
I posted this on Twitter a couple weeks ago, but since it’s time to build out my new site, I figured I’d share it here as well. Below are the most efficient offenses in all of college basketball for the 2018-19 season:
| Team | PPP | TO% | OREB% | ShotVol | FTA/FGA |
| NW Missouri | 1.269 | 0.120 | 0.267 | 1.147 | 0.305 |
| West Liberty | 1.260 | 0.150 | 0.374 | 1.224 | 0.310 |
| NE Wesleyan | 1.246 | 0.163 | 0.312 | 1.148 | 0.288 |
| Marian | 1.245 | 0.129 | 0.303 | 1.174 | 0.262 |
| St. John’s (MN) | 1.230 | 0.172 | 0.347 | 1.175 | 0.297 |
| Barton | 1.226 | 0.155 | 0.374 | 1.219 | 0.278 |
| Gonzaga | 1.226 | 0.149 | 0.315 | 1.166 | 0.353 |
| Notre Dame OH | 1.216 | 0.156 | 0.351 | 1.195 | 0.326 |
| Valdosta St. | 1.215 | 0.151 | 0.342 | 1.192 | 0.314 |
| Charleston (WV) | 1.214 | 0.158 | 0.335 | 1.177 | 0.400 |
| WV Tech | 1.209 | 0.166 | 0.357 | 1.191 | 0.324 |
| Bellarmine | 1.209 | 0.173 | 0.281 | 1.108 | 0.373 |
| Colorado Mines | 1.206 | 0.155 | 0.339 | 1.184 | 0.391 |
| Whitman | 1.201 | 0.157 | 0.354 | 1.197 | 0.403 |
| Southwestern (KS) | 1.201 | 0.172 | 0.337 | 1.165 | 0.295 |
| Nova SE | 1.196 | 0.147 | 0.349 | 1.202 | 0.301 |
| Emory | 1.195 | 0.154 | 0.368 | 1.214 | 0.282 |
| Morningside | 1.189 | 0.147 | 0.276 | 1.129 | 0.277 |
| Hofstra | 1.188 | 0.138 | 0.268 | 1.130 | 0.377 |
| Northern St. | 1.187 | 0.158 | 0.306 | 1.148 | 0.342 |
Synergy uses a different formula to calculate possessions, declaring offensive rebounds as the start of a new possession. I am using the more standard formula:
FGA + (0.475 x FTA) – OREBs + TOs = Possessions
Then, you take your points scored in a season and divide it by your number of possessions. If you scored 2,235 points in a 2,000-possession season, your PPP is 1.117.
Here’s the statistical commonalities I see:
- Each team was below the national average in TO%. For convenience purposes, I’m using the Division 1 averages here. The D-1 TO% average, per KenPom, was 18.5%. Every single team listed beat that, and it played a huge part in maximizing their possessions.
- 16 of the 20 were above the national average in OREB%. Unsurprisingly, getting extra possessions helps you score more points.
- Most importantly: every team beat the national Shot Volume average of 109.9, and only one team ended up lower than 112.9. For further research on Shot Volume, I strongly recommend this piece by John Gasaway, which I’ve used as the basis of this data for years. He has a new metric called SVI that’s a little more difficult to calculate, but upon request, I can do that, too.
- However, the teams actually ranked slightly below the national average for their ratio of FT attempts to FG attempts. Considering that all but two teams in this list took at least 35.4% of their attempts from three, I’ll chalk it up to more perimeter-oriented offenses.
Update, April 19, 2019: Here’s each team’s shot chart, their best play types, and team shooting splits, and tempo. All numbers listed below are from Synergy Sports, with tempo calculated with the equation listed above. The colors you see below are based on this Synergy grading scale:

Onward.
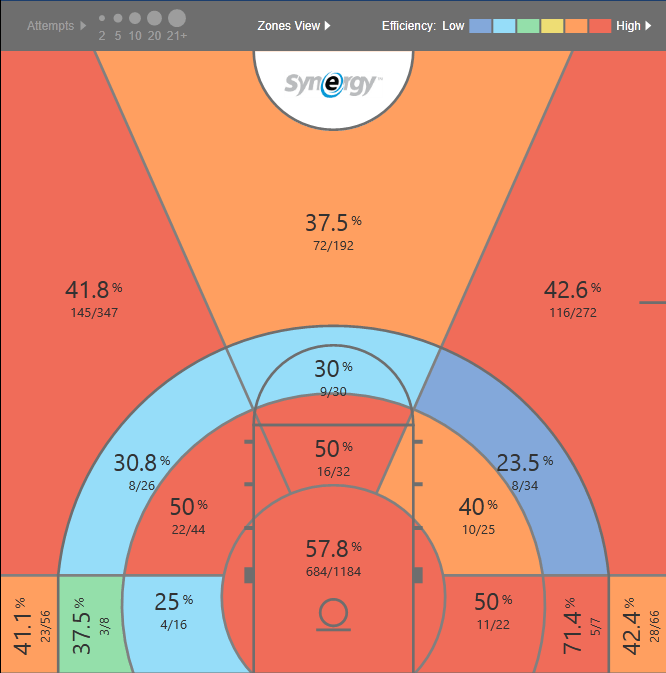
20. Northern State Wolves (Aberdeen, SD)
- Points Per Possession: 1.187
- Best Play Types (90th-percentile or above, at least 5% usage): Spot-Up (1.184 PPP on 597 possessions, 100%), Cuts (1.427 PPP on 206 possessions, 100%)
- Percentage of Shots Attempted: 40.6% Rim (layups, dunks, tips), 23.3% Non-Rim Twos (all other shots), 36.1% 3PA
- Shots Made by Category: 62.6% Rim, 40.5% Non-Rim Twos, 41.6% 3PT
- Tempo: 66.95 possessions per game (would rank 280th in D-1 among 353 teams)
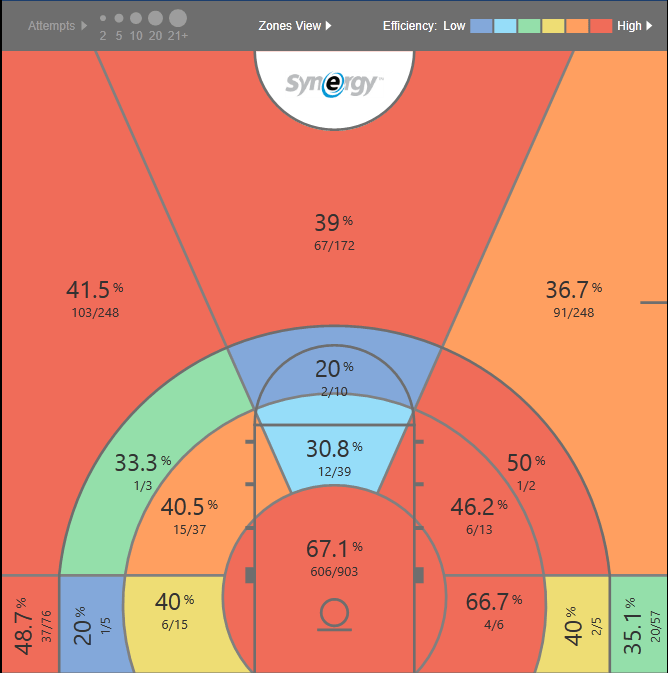
19. Hofstra Pride (Hempstead, NY)
- Points Per Possession: 1.188
- Best Play Types: Spot-Up (1.084 PPP/669 possessions, 97%), P&R Ball Handler (0.929 PPP/562 possessions, 98%), Cuts (1.398 PPP/171 possessions, 100%)
- Percentage of Shots Attempted: 32.9% Rim, 28.3% Non-Rim Twos, 38.8% 3PA
- Shots Made by Category: 65.7% Rim, 41.7% Non-Rim Twos, 38.5% 3PT
- Tempo: 68 possessions (232nd in D-1)
18. Morningside Mustangs (Sioux City, IA)

- Points Per Possession: 1.189
- Best Play Types: Post-Up (1.097 PPP/392 possessions, 99%), Transition (1.159 PPP/333 possessions, 95%), P&R Ball Handler (1 PPP/226 possessions, 98%)
- Percentage of Shots Attempted: 45.9% Rim, 16.2% Non-Rim Twos, 36.9% 3PA
- Shots Made by Category: 64.9% Rim, 47.1% Non-Rim Twos, 37.7% 3PT
- Tempo: 71.89 possessions (would rank 51st of 353 in D-1)
17. Emory Eagles (Atlanta, GA)
- Points Per Possession: 1.195
- Best Play Types: Transition (1.112 PPP/643 possessions, 91%), Cuts (1.274 PPP/175 possessions, 94%)
- Percentage of Shots Attempted: 40.7% Rim, 19.4% Non-Rim Twos, 39.9% 3PA
- Shots Made by Category: 62% Rim, 42% Non-Rim Twos, 36% 3PT
- Tempo: 77.73 possessions (would rank #3 of 353 in D-1)
16. Nova Southeastern Sharks (Davie, FL)

- Points Per Possession: 1.196
- Best Play Types: Spot-Up (1.111 PPP/760 possessions, 96%)
- Percentage of Shots Attempted: 44.7% Rim, 19.1% Non-Rim Twos, 36.2% 3PA
- Shots Made by Category: 57.5% Rim, 41% Non-Rim Twos, 40.5% 3PT
- Tempo: 80.73 possessions (would rank #1 of 353 in D-1)
15. Southwestern Moundbuilders (Winfield, KS)
- Points Per Possession: 1.201
- Best Play Types: P&R Ball Handler (0.983 PPP/302 possessions, 97%), Cuts (1.348 PPP/184 possessions, 98%)
- Percentage of Shots Attempted: 32.4% Rim, 21.3% Non-Rim Twos, 46.3% 3PA
- Shots Made by Category: 65.4% Rim, 47.1% Non-Rim Twos, 39.4% 3PT
- Tempo: 74.18 possessions (would rank #13 of 353 in D-1)
14. Whitman Blues (Walla Walla, WA)

- Points Per Possession: 1.201
- Best Play Types: Transition (1.122 PPP/892 possessions, 93%), Spot-Up (1.073 PPP/686 possessions, 96%), P&R Ball Handler (0.955 PPP/198 possessions, 98%)
- Percentage of Shots Attempted: 42.7% Rim, 17.7% Non-Rim Twos, 39.6% 3PA
- Shots Made by Category: 60.3% Rim, 41.7% Non-Rim Twos, 39.6% 3PT
- Tempo: 85.95 possessions (would be #1 of 353 in D-1, would be most since 2006-07 VMI)
13. Colorado Mines Orediggers (Golden, CO)
- Points Per Possession: 1.206
- Best Play Types: P&R Ball Handler (0.948 PPP/267 possessions, 95%)
- Percentage of Shots Attempted: 33.7% Rim, 32.4% Non-Rim Twos, 33.9% 3PA
- Shots Made by Category: 62.6% Rim, 45.6% Non-Rim Twos, 39.4% 3PT
- Tempo: 68.4 possessions (would rank #211 of 353 in D-1)
12. Bellarmine Knights (Louisville, KY)

- Points Per Possession: 1.209
- Best Play Types: Spot-Up (1.114 PPP/722 possessions, 98%), Cuts (1.368 PPP/386 possessions, 98%), Transition (1.215 PPP/381 possessions, 99%), Post-Up (1.075 PPP/308 possessions, 97%)
- Percentage of Shots Attempted: 43.1% Rim, 20.3% Non-Rim Twos, 36.6% 3PA
- Shots Made by Category: 71.2% Rim, 49% Non-Rim Twos, 37% 3PT
- Tempo: 66.37 possessions (would rank #300 of 353 in D-1)
11. West Virginia Tech Golden Bears (Beckley, WV)

- Points Per Possession: 1.209
- Best Play Types: Spot-Up (1.127 PPP/647 possessions, 97%), P&R Ball Handler (0.922 PPP/293 possessions, 91%)
- Percentage of Shots Attempted: 40.3% Rim, 18.9% Non-Rim Twos, 40.8% 3PA
- Shots Made by Category: 60.1% Rim, 37% Non-Rim Twos, 41.9% 3PT
- Tempo: 78.43 possessions (would rank #3 of 353 in D-1)
10. Charleston Golden Eagles (Charleston, WV)
- Points Per Possession: 1.214
- Best Play Types: Transition (1.211 PPP/342 possessions, 98%), Post-Up (1.224 PPP/161 possessions, 100%)
- Percentage of Shots Attempted: 49.3% Rim, 17.2% Non-Rim Twos, 33.5% 3PA
- Shots Made by Category: 65.7% Rim, 38.9% Non-Rim Twos, 36.4% 3PT
- Tempo: 71.25 possessions (would rank #72 of 353 in D-1)
9. Valdosta State Blazers (Valdosta, GA)
- Points Per Possession: 1.215
- Best Play Types: Spot-Up (1.085 PPP/492 possessions, 94%), Cuts (1.296 PPP/206 possessions, 92%), Post-Up (1.03 PPP/199 possessions, 94%)
- Percentage of Shots Attempted: 39.9% Rim, 19.8% Non-Rim Twos, 40.3% 3PA
- Shots Made by Category: 62.7% Rim, 39.7% Non-Rim Twos, 39.4% 3PT
- Tempo: 73.86 possessions (would rank #18 of 353 in D-1)
8. Notre Dame Falcons (South Euclid, OH)

- Points Per Possession: 1.216
- Best Play Types: Post-Up (1.004 PPP/258 possessions, 92%), Cuts (1.302 PPP/255 possessions, 93%), P&R Ball Handler (1.009 PPP/227 possessions, 100%)
- Percentage of Shots Attempted: 36.6% Rim, 20.9% Non-Rim Twos, 42.5% 3PA
- Shots Made by Category: 66.9% Rim, 39.1% Non-Rim Twos, 36% 3PT
- Tempo: 72.23 possessions (would rank #45 of 353 in D-1)
T-6. Gonzaga Bulldogs (Spokane, WA)
- Points Per Possession: 1.226
- Best Play Types: Transition (1.159 PPP/659 possessions, 94%), Spot-Up (1.074 PPP/651 possessions, 96%), Post-Up (1.073 PPP/286 possessions, 99%)
- Percentage of Shots Attempted: 42.9% Rim, 21.8% Non-Rim Twos, 36.3% 3PA
- Shots Made by Category: 69.7% Rim, 45.2% Non-Rim Twos, 36.3% 3PT
- Tempo: 71.4 possessions (ranked #66 in D-1)
T-6. Barton Bulldogs (Wilson, NC)
- Points Per Possession: 1.226
- Best Play Types: Transition (1.244 PPP/488 possessions)
- Percentage of Shots Attempted: 41.8% Rim, 24.6% Non-Rim Twos, 33.6% 3PA
- Shots Made by Category: 61% Rim, 43.6% Non-Rim Twos, 41% 3PT
- Tempo: 73.41 possessions (would rank #22 of 353 in D-1)
5. St. John’s Johnnies (Collegeville, MN)

- Points Per Possession: 1.23
- Best Play Types: Spot-Up (1.072 PPP/544 possessions, 96%), P&R Ball Handler (1.003 PPP/316 possessions, 98%), Cuts (1.372 PPP/266 possessions, 99%)
- Percentage of Shots Attempted: 45.5% Rim, 19.2% Non-Rim Twos, 35.3% 3PA
- Shots Made by Category: 66.3% Rim, 47.1% Non-Rim Twos, 40.6% 3PT
- Tempo: 66.51 possessions (would rank #295 of 353 in D-1)
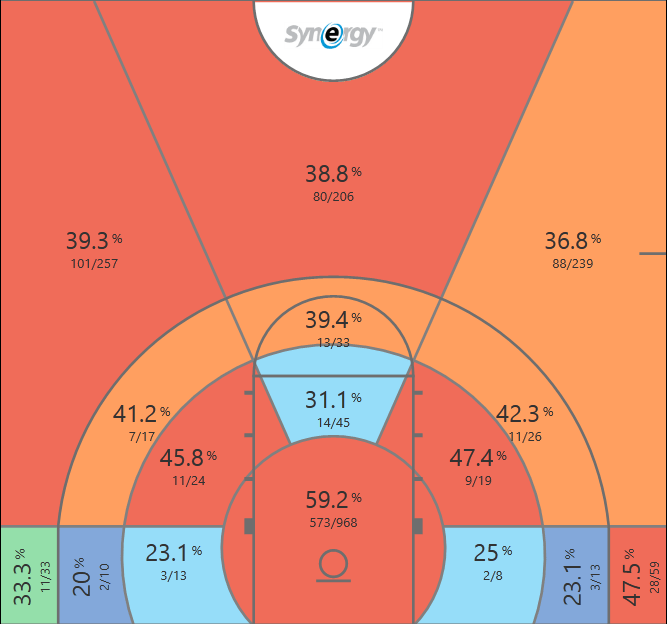
4. Marian Knights (Indianapolis, IN)

- Points Per Possession: 1.245
- Best Play Types: Spot-Up (1.112 PPP/457 possessions, 96%), Transition (1.218 PPP/440 possessions, 99%), P&R Ball Handler (1.1 PPP/420 possessions, 100%)
- Percentage of Shots Attempted: 33% Rim, 31.6% Non-Rim Twos, 35.4% 3PA
- Shots Made by Category: 63.6% Rim, 46.9% Non-Rim Twos, 42.5% 3PT
- Tempo: 71.05 possessions (would rank #80 of 353 in D-1)
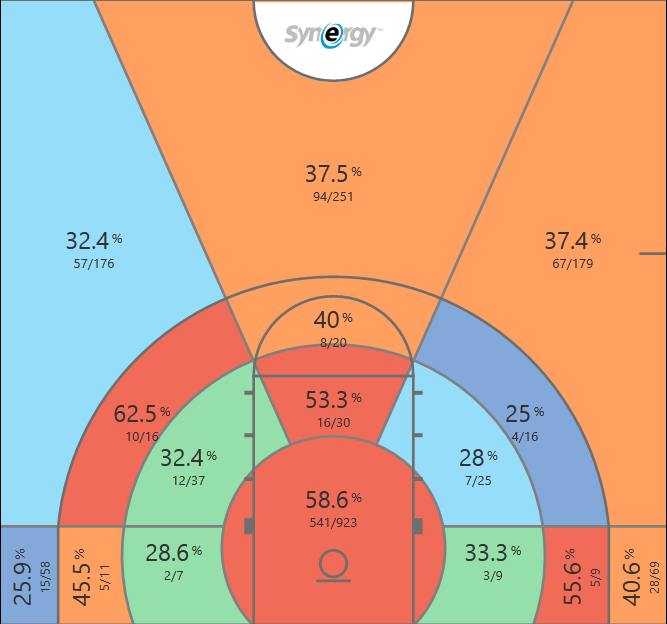
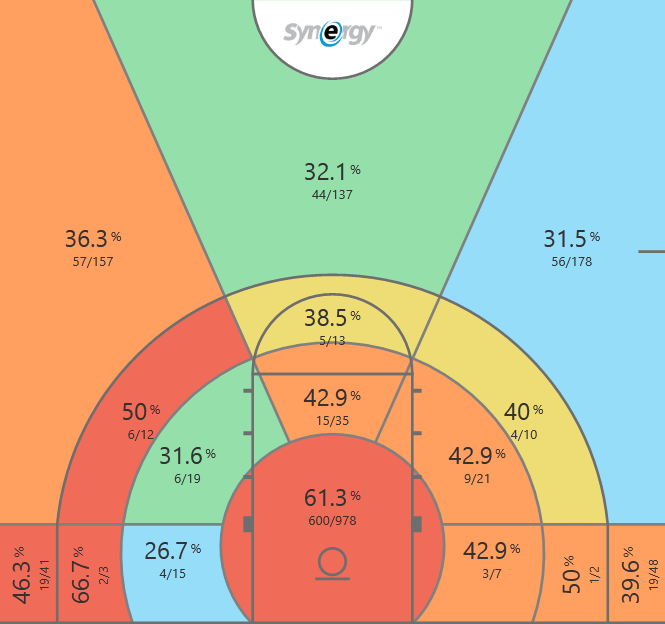
3. Nebraska Wesleyan Prairie Wolves (Omaha, NE)
- Points Per Possession: 1.246
- Best Play Types: Transition (1.171 PPP/598 possessions, 98%), Spot-Up (1.074 PPP/557 possessions, 97%), Cuts (1.422 PPP/268 possessions, 99%)
- Percentage of Shots Attempted: 41.7% Rim, 14.7% Non-Rim Twos, 43.6% 3PA
- Shots Made by Category: 69.8% Rim, 44.6% Non-Rim Twos, 40.6% 3PT
- Tempo: 72.43 possessions (would rank #44 of 353 in D-1)
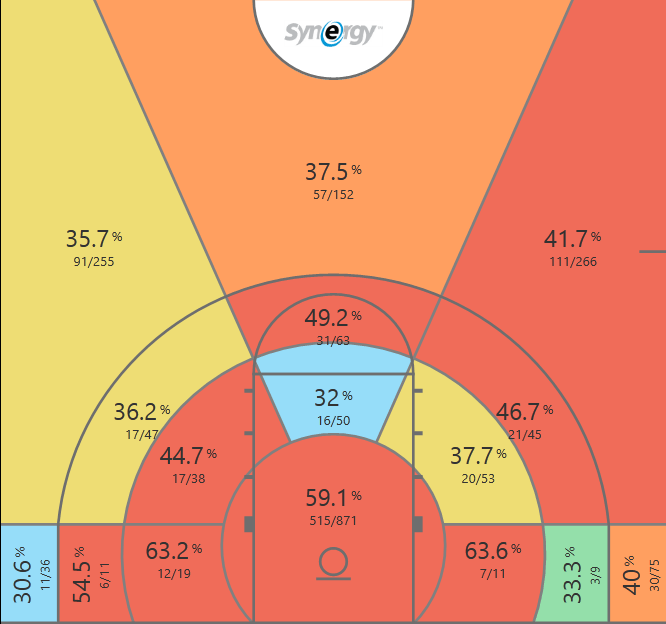
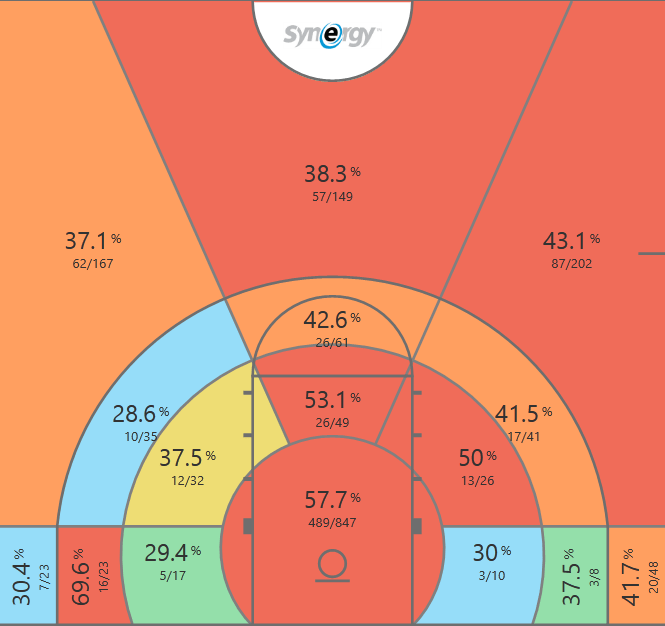
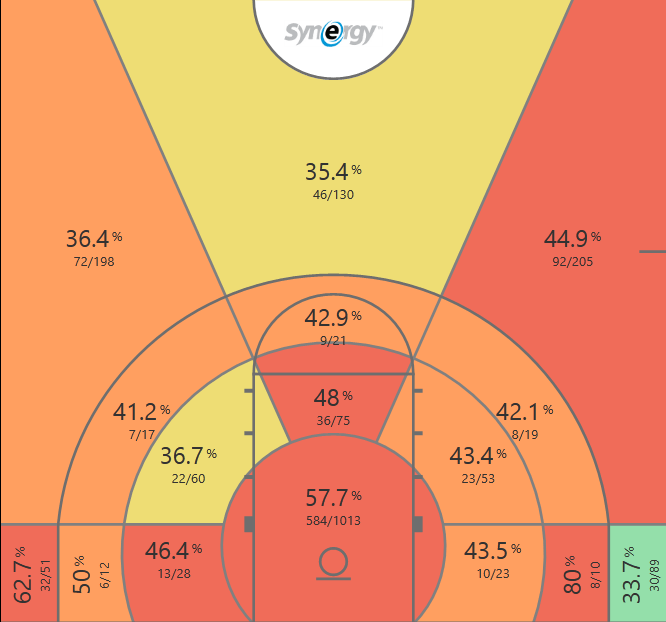
2. West Liberty Hilltoppers (Wheeling, WV)
- Points Per Possession: 1.26
- Best Play Types: Spot-Up (1.111 PPP/845 possessions, 97%), Hand-Off (1.075 PPP/214 possessions, 93%), Off Screen (1.12 PPP/183 possessions, 93%)
- Percentage of Shots Attempted: 43.3% Rim, 17.5% Non-Rim Twos, 39.2% 3PA
- Shots Made by Category: 61.4% Rim, 37.2% Non-Rim Twos, 42.5% 3PT
- Tempo: 80.02 possessions (would rank #1 of 353 in D-1)
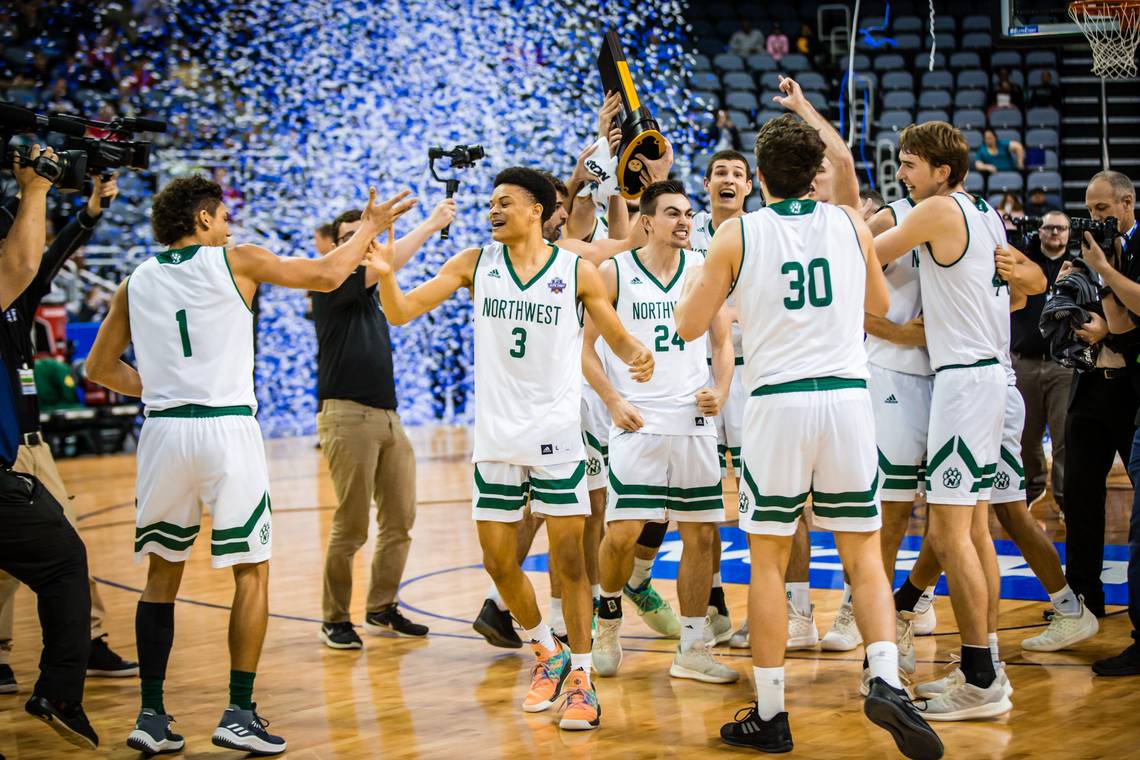
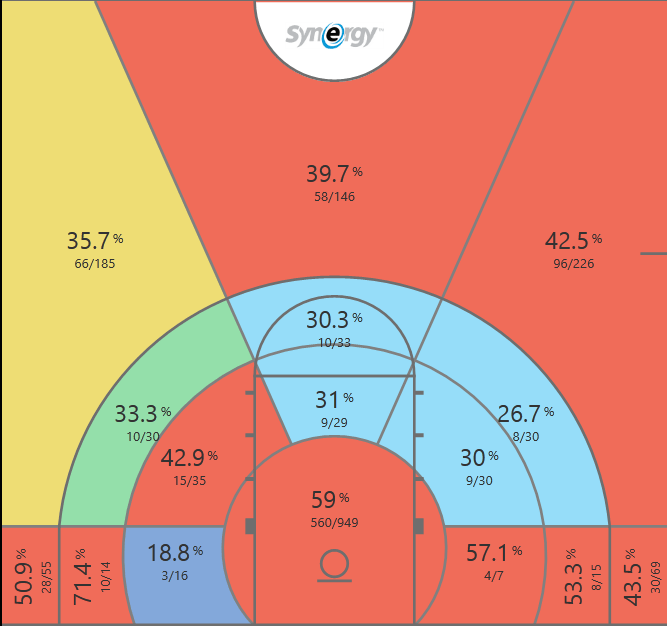
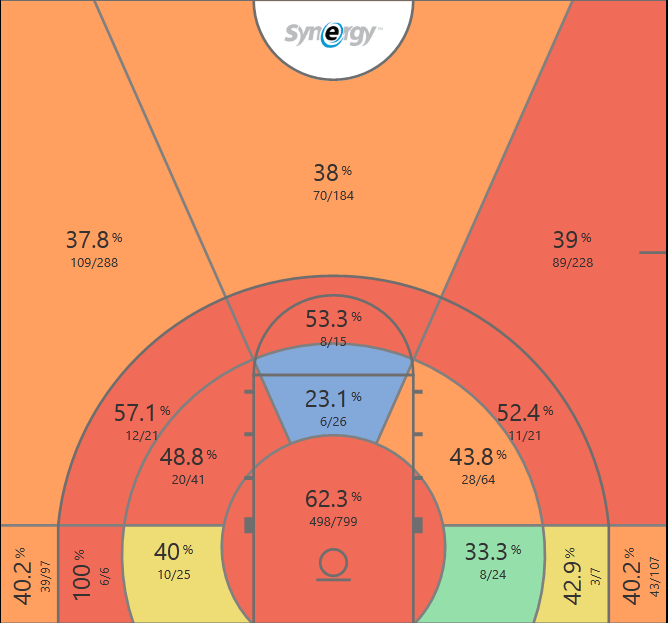
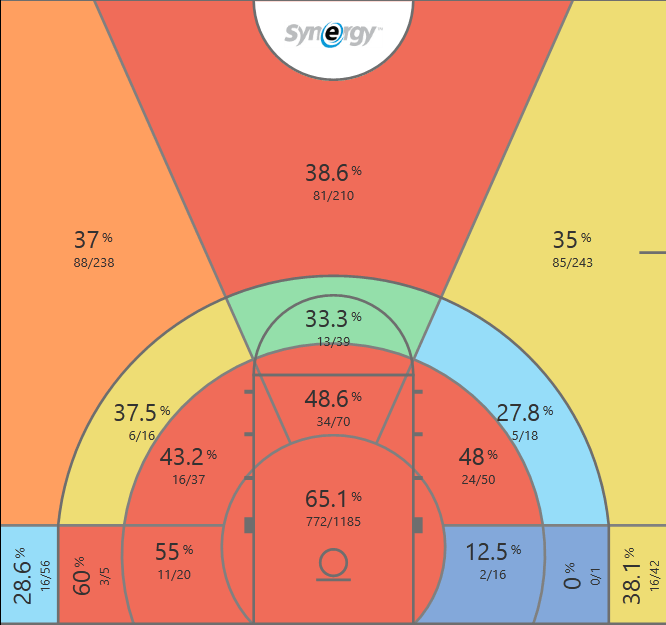
1. Northwest Missouri State Bearcats (Maryville, MO)

- Points Per Possession: 1.269
- Best Play Types: Spot-Up (1.131 PPP/870 possessions, 99%), P&R Ball Handler (1.021 PPP/426 possessions, 100%), P&R Roll Man (1.22 PPP/268 possessions, 10%)
- Percentage of Shots Attempted: 43.1% Rim, 11.4% Non-Rim Twos, 45.5% 3PA
- Shots Made by Category: 62.5% Rim, 45.3% Rim, 40.9% 3PT
- Tempo: 64.92 possessions (would rank #336 of 353 in D-1)
Later this offseason, you’ll see video investigations of most of these offenses in a series to be revealed soon. Any and all questions may be directed to statsbywill@gmail.com OR on Twitter @statsbywill.

2 thoughts on “The most efficient offenses in men’s college basketball, 2018-19”