College Basketball Watchability Above Replacement (CBBWAR): A new-old way to find the NCAA’s most entertaining teams

I think anyone who’s read my writing on Tennessee basketball can tell that over the course of the last month, the writing itself has grown more…negative? Cynical? Downward-looking? Over it? I’m not sure what the phrase is, but I’ve had a couple of people reach out with suggestions like “watch other teams.” I appreciate said suggestion, as I already do watch other teams, but that idea became rooted in my head as something I’d like to explore.

Long ago on Fangraphs, a baseball statistics site, writer Carson Cistulli created NERD, “an attempt to summarize in one number (on a scale of 0-10) the likely aesthetic appeal or watchability, for the learned fan, of a player or team or game.” I like baseball, but I realized about ten years ago that what I really love is postseason baseball. Regular season baseball…it’s 162 games, man. But instead of giving up on 162 games entirely, I loved reading Cistulli’s NERD reports every day, pinpointing the most interesting games of the week.

Cistulli left NERD (and Fangraphs) behind a few years ago, but the formula remains out there. I copied it to run my own sort of NERD for MLB this season, with a few tweaks (higher emphasis on homers, because homers) and new calculations. It selected the Los Angeles Dodgers, Toronto Blue Jays, and Tampa Bay Rays as the three most watchable baseball teams of 2021, which, yeah. (Braves fans: you were fifth. I imagine that if Weighted NERD existed, you would probably be top four or top three.)

Anyway, this is a long way of getting to the point: I’ve workshopped a similar idea for college basketball. Ensuring that all 359 team ratings are 100% accurate is borderline impossible, because 1) I have a day job and 2) As such, I’m unable to watch a lot of teams until they either play the team I cover or they’re on a network that everyone can agree on. I watch a lot of college hoops, but Sean Paul (not the singer) and others are whooping me in this regard.

To make up for this, I’ve devised a metric I’m loosely calling College BasketBall Watchability Above Replacement (CBBWAR). The name could be changed, but it’s a name that describes the point of the project and the acronym makes it sound like something that will get $41 billion dollars in military funding somehow. Here are the components involved, all sourced from either KenPom or Hoop-Math:

  • Tempo (alternately possessions per game)
  • KenPom Adjusted Offensive Efficiency (Adj. OE)
  • Effective Field Goal Percentage (eFG%)
  • Percentage of Shots That Are Long Twos (Mid%)
  • FG% at the Rim (Rim%)
  • Three-Point Efficiency (3PT%)
  • Defensive Block Rate (Block%)
  • Defensive Steal Rate (Steal%)
  • Three-Point Attempt Rate (3PA%)

Here’s how these components are currently weighted in my Excel sheet:

Tempo*0.5 + OE + eFG*1.5 – Mid*0.5 + Rim*0.5 + 3PT%*.75 + Block*0.5 + Steal*0.5 + 3PA*0.25 + Constant (currently 2.2, a completely arbitrary number to provide us with higher-rated teams)

What this roughly comes out to is an equation that values offense at 75%, defense about 18%, and tempo 7%. I like fast games, but I like seeing shots go in the net more. I do not like watching a bunch of mid-range twos by teams that generally cannot hit them. (Consider that the NBA average on a mid-range shot this season is 40.3%; in college basketball, it’s 36.9%, and only 21% of teams in America shoot at 40.3% or better. Thanks, but no thanks.) I like when teams hit threes. Also, I like when teams create havoc on defense by blocking a bunch of shots and forcing turnovers.

Unsurprisingly, eFG% and Adj. OE have the strongest correlation to a higher CBBWAR score at +0.94 and +0.86. Of the defensive stats, blocks (+0.30) have a higher correlation to watchability than steals (+0.10), which makes sense, because really good blocks are freaking cool. Tempo makes very little of a difference, which is ideal.

Your personal formula is probably different, which is fine. No two watchability metrics would ever be the same. But for me, this makes sense, and maybe it will for you, too. This metric is a work in progress, so don’t be surprised if/when it changes. For now, CBBWAR is what I’m using going forward to figure out which games and which teams are the ones I want to watch the most.

The initial CBBWAR rankings can be scrolled at the sheet below. A version where you can see the individual Z-scores is linked here:

As seen above, here’s the initial top 10 teams:

  1. Gonzaga (+14.19)
  2. Purdue (+12.5)
  3. Arizona (+11.48)
  4. Kansas (+10.56)
  5. South Dakota State (+10.15)
  6. Auburn (+10.08)
  7. Duke (+9.83)
  8. Iowa (+9.68)
  9. Davidson (+9.62)
  10. Colorado State (+9.46)

I genuinely like and would approve of this initial draft. To my eyes, I don’t see many teams missing from this top 10 (or top 20, to extend) that would be huge misses. Some of the selections will certainly appear strange, such as a 9-7 Memphis team being 18th overall or Santa Clara, the fifth-best WCC team, being in the top 12. What I would offer is this: no metric is perfect, and these two are early outliers. Still: as someone who isn’t a Memphis fan, this Memphis team is hilarious and amazing to watch. Santa Clara plays fast, scores efficiently, and is one of the best shooting teams in America. I kind of get it.

There are improvements to be made, certainly. I’ll expand on CBBWAR in coming weeks, with more changes after further testing and additional analysis with fair frequency. Hopefully, this gets us closer as a college basketball community to some sort of tool that combines team quality and subjective enjoyment. It will never be perfect or fully satisfactory, but I think it’s a decent start to expand upon.

Lastly, here’s a sheet that will be updated daily with the day’s most watchable games, per CBBWAR.

Statcast Goofin’, Vol. 1: Let’s find some regression candidates

I’ve resolved to make this the year I write about something other than basketball. The last two offseasons, I’ve done long interview series across all levels of college hoops; this year, I want to try something different. I’ve always liked baseball to some extent, with my love for the sport waning from the time I started college in 2011 until I realized how much I actually did love it when it’s good in 2020. With six months to go until the next college basketball game, it makes sense for me to pivot to writing in some form about baseball.

Why not give it a shot? Baseball is the sport that’s had the greatest advancements in statistics, not only with Bill James’ work in the late 1970s/early 1980s and the Fangraphs posts you may think of. It’s an easier stats-heavy sport to get invested in than nearly anything else.

For my first crack at it in a very long time, I thought I’d apply a similar principle I’ve used in my basketball writing to this MLB season thus far: positive and negative regression. I write frequently about the idea of a player being due or not due for something based on the quality of their offensive/defensive efforts; the same absolutely applies to baseball, which is a sport with higher variance and a healthy amount of luck involved. If you let yourself get too attached game-to-game, you’ll go mad; if you appreciate the madness and embrace it, you can laugh and laugh when small sample sizes go haywire.

Below, I’ve singled out some teams, batters, and pitchers who could be in line for positive/negative regression based on MLB’s amazing depth of tools, including Statcast/Baseball Savant. Whether this proves to be useful or “true” is still to be seen – these are very small sample sizes, after all – but I’d rather start with a rough-draft post than never start at all. Hopefully, it’ll give you something to watch for, if nothing else.

Teams

One of the biggest stories of the first month of the season was the suddenly-moribund New York Yankees offense. After a few years of owning a roster full of mashers, it was widely expected that New York would have the best offense in MLB this season. Why wouldn’t they? If your roster contains Giancarlo Stanton, Aaron Judge, Gleyber Torres, and D.J. LeMahieu, it should be the best in baseball. Even in a shortened season last year, the Yankees were on a 162-game pace of 254 homers and 851 runs scored, which would have been downgrades from their amazing 2019 (306 HRs, 943 runs) but were both great numbers. And yet: April looked like the Yankees would somehow continue this downward turn.

Through one month of play, the Yankees were hitting just .224, scoring barely 3.9 runs a game, and were on pace for 231 homers, a fine total that would’ve ranked barely above the league average in 2019. (There’s discussion to be had on how much the deadened ball MLB has introduced has hurt the Yankees in particular, but I’d prefer to leave that to smarter writers.) Prior to starting a weekend series against Detroit on April 30, New York was 11-14 and in a world of trouble, at least if you pay attention to the New York press. The Yankees struggles on offense, strangely enough, could be explained in one simple fact: they were very unlucky.

No team had a worse batting average on balls in play with an expected batting average of .300 or higher than the Yankees, per Statcast. They were hitting just .542 on these; they were expected to hit .623, which was much closer to league average. Along with that, only three teams were less lucky on balls with an exit velocity of 95 MPH or higher (.473 BA, .553 xBA). Regression would come soon enough; it was just a matter of how quickly it arrived. Luckily for the Yankees, there are few things that can provide the positive boost you need than playing the Detroit Tigers.

The Yankees swept that series and, as of this writing, are on a five-game win streak. They trail the division-leading Red Sox by a game-and-a-half, just a week or so after being in last place in the division. Baseball’s a weird sport, and team-wide cold streaks can exist. It did for the league’s probable best offense, and it wouldn’t surprise me to see them return to stardom pretty quickly.

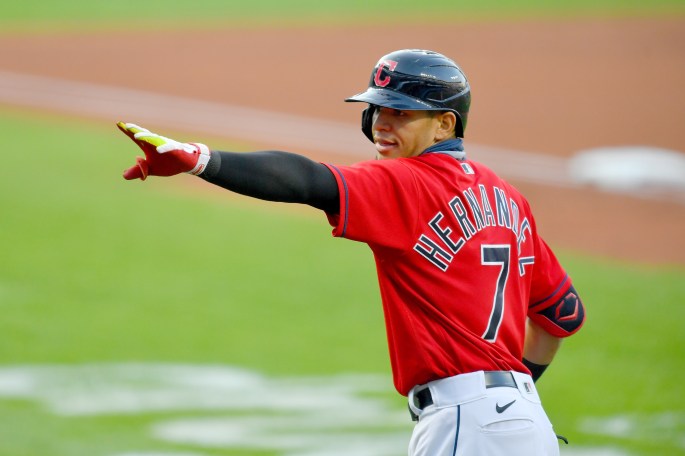
A team with lower expectations and a lower high-end that’s still due for something better offensively: the Cleveland baseball team. Lake Erie’s faves are in a three-way tie for the AL Central lead, which is great and all, but their offense has been quite unbearable to watch. They’re hitting .209 (third-worst in the league) with a 90 OPS+ (22nd), and while batting average is a pretty tired metric at this point, it’s still notable that over half of Cleveland’s main lineup is below .200 on the season. It’s not like anyone expects Cesar Hernandez to be this amazing hitter, but he’s a .277 career hitter with remarkable consistency over the last eight seasons. He’s hitting .187 at the time this sentence is being typed.

In the metric mentioned above with the Yankees – expected BA on a 95+ MPH exit velocity – Cleveland was .120 below their expected value in April. It’s really hard for that to stay the same for an entire season. In particular, Hernandez is hitting an unbelievable .235 on balls with an exit velocity of 95+ MPH; his expectation based on the speed and launch angle of these balls in play is .498. Four of Cleveland’s generally-everyday starters have a batting average .163 worse than their expected batting average on these swings. (Jose Ramirez is also due for some serious positive regression.) In a time where the Central looks a little topsy-turvy thanks to Minnesota’s horrid start, Cleveland could be in position to capitalize on some positive regression soon enough.

Because of the nature of the deadened ball, a lot of teams are hitting slightly below what they’re expected to through a month-plus of play. In terms of negative regression, most of it looks to come on the pitching side, particularly from the Washington Nationals and the Seattle Mariners. Consider it the flipside of the offensive issues for Cleveland and New York. Both Washington and Seattle allow an above-average amount of hard-hit balls, and per Statcast’s xwOBA metric, Washington should be the team most victimized by hard-hit balls so far this season. Instead, only San Diego has allowed a lower batting average on these pounded pitches.

Considering the Nats were expected to have one of the better pitching staffs in baseball this year, perhaps it’s not a huge surprise they’re doing well in this department, but you still should see some sort of regression coming. The same should doubly go for the Mariners, who were expected to have a bottom-six staff in MLB but have instead allowed fewer runs than the Rays, Braves, and Athletics per game this year. Again, this is because Seattle’s failed to be victimized on hard-hit balls this year. They’re allowing the third-lowest batting average on these swings right now, which would be fine if their expected value wasn’t closer to league average. The hardest hit ball they’ve given up this season was a Shohei Ohtani line drive that became a 342-foot out:

The Mariners being in wild card position is very funny, however, and I hope it lasts.

Batters

Unsurprisingly, if you read the previous section, you’ll be expecting to see Cleveland’s Cesar Hernandez in the positive regression category. If you look at Hernandez’s Statcast profile:

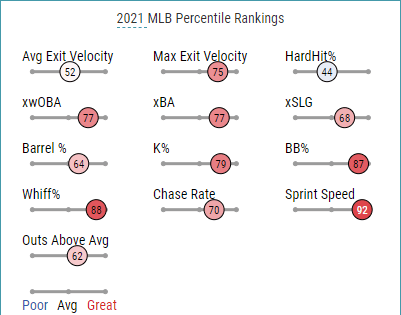
You see a guy who’s doing a lot of things well. He doesn’t swing and miss often; he draws a lot of walks; he’s got a very good expected batting average. So color me skeptical that a guy who simply appears to be a consistently good offensive player is going to hit .187 forever. Through a month-plus of play, Hernandez actually has his highest average exit velocity (89.4%), hard-hit percentage (39.5%), and xwOBA (.376) in the Statcast era. I don’t play fantasy baseball, but if it’s up your alley, it could be a good time to load up on Hernandez.

Likewise, Houston’s Kyle Tucker is overdue for some good batted-ball luck. Tucker’s metrics aren’t as all-around solid as Hernandez, but he still should have a better hitting profile through 30ish games of play than he’s posted. Tucker ranks in the 79th percentile in average exit velocity, the 73rd percentile in hard-hit percentage, and the 81st percentile in whiff percentage. He’s far from a high-average hitter, sitting at .230 for his career, but he appears to be unusually unlucky this year. Tucker’s expected batting average is .279 with an xwOBA of .359; he’s at .183 and .255 on both, respectively. Tucker hits more fly balls than the average hitter, so I can see where his profile could be boom-or-bust, but there still should be something positive coming Tucker’s way.

On the negative side of regression-land: the wonderful Yermin Mercedes (White Sox) and Jared Walsh (Los Angeles Angels). Mercedes has been an absolute joy so far, posting a hilarious .386/.426/.614 split that’s made him one of the best hitters in baseball so far. Mercedes actually has a very high expected batting average (.311) and, if he keeps a similar contact profile, should still be one of the better hitters in baseball this year. However: .311 isn’t .386, and his hard-hit percentage is essentially league average. Still, this is worth enjoying as long as he’s able to ride it.

Walsh is probably a less-likely breakout candidate but a pretty fascinating one in his own right. A 27-year-old, Walsh garnered 63 games worth of action across the 2019 and 2020 seasons after a scalding-hot AAA run in 2019 (.325/.423/.686, 161 wRC+, 36 HRs). His first season was awful (.203/.276/.329, -0.2 WAR); his second was great (.293/.324/.646). Year three would’ve fairly been expected to be something in-between. Instead, Walsh has turned into the second-best hitter on a team that employs Mike Trout, Shohei Ohtani, Anthony Rendon, and Justin Upton.

Walsh has a low hard-hit percentage and a low average exit velocity, which normally spells trouble for any batter and is why his current average is nearly 60 points higher than his expected average. Still, even if Walsh falls to merely being an Upton-level contributor, he’s going to be an important piece to an Angels team that desperately needs a playoff bid.

Pitchers

At least in the city where I reside (Knoxville, TN), no pitcher has had a more upsetting start to the season than Atlanta’s Max Fried. After a fabulous 2019-20 run that resulted in Fried becoming a consensus top-20 pitcher in the league, he’s been a disaster in 2021. Fried’s ERA sits at an awful 8.44, he’s allowed more runs in four starts than he did in 2020’s eleven, and most surprisingly, his slider has gone from one of the best in the league to an eminently-hittable pitch.

My case for positive regression in Fried is both statistical and hopeful; I would like for a great young player to get back to being great. Fried’s expected ERA is still 5.72, which is way above what he or anyone else would want it to be, and he’s allowing a shockingly high amount of hard-hit balls – 40.7% of balls in play, in fact. Fried’s slider has lost a full four inches of break compared to last year:

Which makes a huge difference in terms of where it lands on the bat. Here’s his slider this year, from the same Truist Park camera angle:

If he’s able to find his slider again, he should be able to recover this season’s trajectory somewhat. If he doesn’t…well, pretend you didn’t read this. Luckily, Fried just had a pretty solid outing against Washington, so perhaps he’s on the mend.

Another guy I’m hoping to see positive things from soon is Logan Webb (Giants) He’s been middling so far, with his Statcast profile suggesting better fortunes ahead. Webb’s profile is particularly intriguing: his average exit velocity is just 85.8 MPH (league average 88.3%), he induces a ton of ground balls (60.4%; league average 45.3%), and his sinker has gained three inches of drop compared to last season. All of this should add up to a pretty good starting pitcher. It’s added up to a 5.34 ERA, a full two runs above his expected value based on his performance thus far.

I’m curious to see what happens to Webb, as it’s not like he’s had an amazing run of play in his career to this point (5.36 career ERA, .334 xwOBA, .272 xBA). However, he’s a guy who deserves better results than he’s gotten.

Let’s talk about “tiers” in college basketball

Recently, this graphic came to my attention:

I don’t really know the source of the image, but I assume it originated from a message board. Most of these things do. Anyway, I have some thoughts about it:

  1. Graphic design is clearly not this person’s passion. This thing looks like garbage – “All-Time” and “College Basketball Tiers” are not centered appropriately, black-on-gray almost always looks sad, and the team logos remind me of going to SportsLogos.com in 2005 to look at old logos.
  2. While some tiers are pretty good, others are…questionable. If you know much about college basketball history, it’s hard to question Tier 1 at all. Those five programs are the winningest in college basketball history, and no one else really comes all that close. As crazy as it sounds, the weakest selection is UCLA, a team that’s won more national titles than everyone else but has a lower WP% than anyone else in this group of five. But Tier 2, which features a Georgetown program with one appearance past the Sweet Sixteen since 1996, and UConn, a team with four titles but almost no pre-1990 success…that’s problematic.
  3. I think it’s probably accurate on the whole but could be tweaked to be better. Also, I’m bored and still in the house.

So, with that in mind and with little else to do after my day job ends at home, I set off to form a more perfect list, with tiers still in the mix. There’s a few different ways to fix this image, but on the whole, it’s a good start; this is more about tweaks than wholesale change. Here’s my theoretical fixes to this theoretical image.

  1. More thoroughly define the “tiers” of teams. We won’t change the “blue bloods” tier, because it’s basically flawless. However, “great” needs a better definition. Do “great” programs get there on the strength of continuous success? Do they get there because of title runs that mask periods of inadequacy? The same goes for “good” and “solid”, which are very close to being the same thing. Here’s my proposal: Tier 2 turns into Mostly Great, Tier 3 is Occasionally Great, Mostly Good, Tier 4 Solid and Reliable, and so on.
  2. Make separate lists for high-major and mid-major programs. The original image starts to hit a bit of a mess when it ranks these two separate classes with vastly different resources beside each other. For instance, Iowa and Penn rank alongside each other as Tier 4 programs all-time. At a very specific brand of face value, it makes sense; Iowa’s been to 26 NCAA Tournaments in its history, Penn 24. Here’s the issue: one of these teams plays a much harder schedule. Iowa ranks 13th all-time in Sports Reference’s Simple Rating System; Penn ranks 134th. We can’t realistically mash these two teams against each other unless it actually makes sense to do so. An important qualifier: Gonzaga will rank as a high-major in the last five and last ten years lists, as will every AAC team. While the AAC isn’t quite on the level of the Big Six typically, it’s close enough that they’re above being a mid-major conference. Gonzaga, meanwhile, is a new-era blue-blood.
  3. Make an additional list for the last five years. That way, we have an all-time list, Ken Pomeroy’s 23-year list, and a reading of how programs look to recruits in 2020-21. While UConn may rate out as the 19th-best program on Pomeroy’s list, it’s much harder to make that argument when narrowed to the last five years, when recruits have actually paid attention to college basketball. The average recruit for the 2021-22 season would’ve been about 13 years old in 2015, and it’s hard to expect a then-seventh grader to be following college basketball all that closely beyond a loose understanding of who’s been good in March.

Without further ado, here’s our All-Time, Last Five Years, and Last Ten Years lists.

All-Time College Basketball Tiers (Big Six + select MMs)

  • Tier 1: Blue Bloods. Same as the original – Kentucky, Duke, North Carolina, Kansas, and UCLA.
  • Tier 2: Mostly Great. These are teams that, for most of their history, have been yearly NCAA Tournament fixtures, finish in the AP Poll Top 25, and occasionally win a title. This tier contains ten teams: Indiana, Louisville, Michigan State, Villanova, Illinois, Cincinnati, Ohio State, Michigan, Syracuse, and Arizona. For the most part, these teams have routinely been March fixtures, making deep runs and winning a good amount of conference titles. Historically, Indiana has been closer to Tier 1 than Michigan State, but five years from now, that probably won’t be the case anymore. Cincinnati, of course, looks like a questionable pick. But think about it: in 24 of the last 29 years, they’ve made the NCAA Tournament. They’ve finished ranked in the AP Poll 15 times. They do own a pair of national titles in the early 1960s, and other than the 1980s, they’ve consistently won their conference or contended for it every year post-World War II. They’ve yet to go beyond the Elite Eight since 1992, but I’m not sure it really matters; they are basically always a threat.
  • Tier 3: Occasionally Great, Mostly Good. Teams that make the NCAA Tournament a good amount of the time and every now and then make deep runs, sometimes winning a title. However, their success is not as sustained as Tier 2, and there may be lengthy periods in their history where they were mediocre-to-bad. Along with this, their identity lies in consistently being good, not great. This is the largest tier, with 29 teams included: Purdue, Iowa, NC State, Notre Dame, Maryland, Oklahoma, Marquette, Wisconsin, Memphis, St. John’s, Tennessee, Kansas State, UNLV, Missouri, Oklahoma State, Utah, Florida, BYU, Arkansas, Providence, Alabama, West Virginia, Dayton, Gonzaga, Virginia, Georgetown, Temple, Connecticut, and Texas. (A reminder that these aren’t really in any specific order.) Collectively, these 28 teams own 12 of the national titles in the 35-year period of the 64/68-team field, which is a good chunk of the pie. However: those top five teams own the other 15. (Tier 2 has eight titles among its ten teams, or just under one per program.) The most controversial inclusion here will obviously be Connecticut, a team with four national championships since 1999. However: the program had two NCAA Tournament appearances between 1967 and 1990, didn’t make a Final Four until 1999, and has had lengthy periods in its history – one of which they’re currently in – where the program was irrelevant on a national scale.
  • Tier 4: Solid and Reliable. Rare is it that these programs are outright bad, but even rarer is it that they’re truly attention-grabbing. These programs largely have lived for being an 8 or 9 seed with the occasional Sweet Sixteen run. Seventeen teams are in this tier: Minnesota, Vanderbilt, Stanford, Florida State, USC, Washington, California, Iowa State, UAB, DePaul, Houston, Xavier, LSU, VCU, Pittsburgh, Western Kentucky, Saint Joseph’s, and Texas Tech. Remember that these are all-time, not recent; from 1976 to 1992, DePaul made 14 of 17 NCAA Tournaments and finished in the AP top 10 seven different times. If you’re 55 or older, you likely remember a time when DePaul was legitimately one of the six or so best college basketball programs. The flipside goes for VCU: they have a higher WP% than most of the teams in Tier 3 and some in Tier 2…but they’ve finished ranked in the AP Poll three times ever and the 2011 Final Four run is the only time they’ve advanced past the Round of 32. Likewise, Texas Tech had never advanced past the Sweet Sixteen until they hired Chris Beard. At one point in time, Western Kentucky was a yearly top 15 program or so…but the last time they were ranked period was 2001-02. They’re never bad, but they haven’t gotten anything above a 16 seed since 2009. We’re still giving them the honorary nod.
  • Tier 5: The Murky Middle. Odds are that these teams suffer from one of the following: a mediocre all-time record; not a ton of NCAA Tournament appearances; few deep March runs; few conference titles. They exist in a weird middle range where they’re not openly bad and not very good. Chances are that these teams have some good stretches in their past, and they’ve had flashes of greatness, but they aren’t often a consistent March fixture. Fourteen teams are in this tier: Oregon State, Oregon, Nebraska, Georgia Tech, Auburn, Clemson, Colorado, Tulsa, Arizona State, South Carolina, Mississippi State, New Mexico, Seton Hall, Georgia, and Virginia Tech. Some of these teams have made a Final Four recently, and Oregon and South Carolina even made it in the same year. That’s nice! It also doesn’t excuse the fact that South Carolina has just two NCAA Tournament appearances since 1998 or that Oregon went from 1961 to 1995 without a single March appearance. (Phil Knight cures all, it seems.) Oregon State has made just one NCAA Tournament appearance since 1990, but for serious stretches of time (1975-1990, mostly), they hung around the top of the Pac-8 (and then Pac-10) yearly. In true Oregon State fashion, their 1980-81 and 1981-82 teams went a combined 51-7 but failed to make the Final Four both times. They haven’t won a Tournament game since, and odds are their brief 2016 Tournament appearance is the first time anyone under 30 has ever thought about Oregon State basketball. Seton Hall barely got in here, because despite being thoroughly mediocre from roughly 1957 to 1987, they do own a national title game appearance and have made several March appearances over the last three decades. The last truly great team they had was in 1992-93, though.
  • Tier 6: Baylor. They don’t really fit anywhere else, to be honest. It’s really hard to neatly find a spot for a team with seven 20+ loss seasons, multiple 20+ year NCAA Tournament droughts, and also two Elite Eight runs and a team that likely would’ve gotten a third this year. Historically, their lows have been lower than just about anyone in Tier 5…but so have the highs. We’ll punt.
  • Tier 7: Don’t Buy or Sell, It’s Crap. For the most part, these programs have a mediocre history and have won little of serious substance. Sometimes, one of these teams will pop up out of nowhere en route to a 3 seed and a self-immolation in the Sweet Sixteen. Seven teams go here: Miami, Boston College, Washington State, Ole Miss, Texas A&M, Penn State, and TCU.
  • Tier 8: Despair. This is the lowest of the low. These teams, for the most part, have never experienced serious success, and just making the Tournament feels like a heroic feat. Never mind actually winning a game! I get sad thinking about these programs. Five teams stand out here: Rutgers, Northwestern, South Florida, Southern Mississippi, and Tulane. Northwestern did make the NCAA Tournament in 2017, and Rutgers was well on track to do it in 2020. That being said…both schools would’ve been rapturously excited to be an 8 or 9 seed, because it would’ve been Rutgers’ first visit in nearly 30 years and it was Northwestern’s first visit ever. South Florida, Southern Miss, and Tulane are three mid-major programs with three post-1984 NCAA Tournament runs each, and it really feels like all three programs should be better…but they just aren’t. South Florida has lost fewer than 10 games in a season once in 47 seasons, Southern Miss’ only sustained success in my lifetime was immediately undone by Donnie Tyndall’s NCAA troubles, and Tulane hasn’t touched double-digit conference wins since 1997.

Okay! That was fun. Let’s now move on to the Last Five Years lists. Below are the same tiers, but simplified to the last five years only. The first list is high-majors + AAC + Gonzaga; the second list is mid-majors only.

The Last Five Years of College Basketball Tiers (Big Six, AAC, and Gonzaga)

  • Tier 1: The New-Age Blue Bloods. Hey, remember when the first list had an easy, widely-agreed-upon definition of Blue Bloods? That doesn’t exist right now. New powerhouses have risen up to become the best programs in college basketball. There’s a new top five program list in college basketball: Virginia, Kansas, Duke, Villanova, and Gonzaga. Four of the last five national titles belong to this group, and the teams without a recent title (Kansas and Gonzaga) have made at least three Elite Eights from 2015 onward. The most controversial exclusion(s?) from this list are covered in Tier Two.
  • Tier 2: Mostly Great. Same criteria: for the most part, these squads have been yearly NCAA Tournament fixtures, with half of them making a Final Four run and seven of the ten owning at least one Elite Eight visit. These ten programs are Michigan State, Kentucky, Purdue, North Carolina, Michigan, Louisville, West Virginia, Baylor, Cincinnati, and Texas Tech. A quick rebuttal to those who would like MSU and Kentucky in Tier 1: while the argument could exist, it’s hard to back it up statistically. Michigan State did make the Final Four in 2015 and 2019, but their 2016-2018 performances – Round of 64, Round of 32, Round of 32 – don’t measure up with those of the top five. Kentucky, meanwhile, hasn’t been to a Final Four since the 38-1 team and has slowly started to lose the edge they’d built in recruiting for years. They’re the class of the SEC, but the SEC hasn’t been one of the three best Big Six conferences since 2006-07, per KenPom. The Big East, a non-football conference with a significantly smaller budget than the SEC, is a clearly superior conference. Then again, those schools generally don’t make coaching hires as bad as the SEC’s.
  • Tier 3: Occasionally Great, Mostly Good. Teams that make the NCAA Tournament a good amount of the time and every now and then make deep runs, sometimes winning a title. Along with this, their identity lies in consistently being good, not great – the average team in this group has had one, maybe two top-4 seeds, but on the whole, they’ve not typically been one of the 16 best teams in the field. In a couple of cases, a team has made a deep run in the Tournament but has had a few down years otherwise. Tough selections were made in this one. Included in this group: Florida State, Oregon, Florida, Maryland, Xavier, Wisconsin, Houston, Wichita State, Creighton, Butler, Arizona, Seton Hall, Oklahoma, Tennessee, Kansas State, Ohio State, and Auburn. The toughest selections were on both ends here: Florida State would have made it four straight NCAA Tournament bids this year, with three of those being top-4 seeds. They had a solid case for the Mostly Great tier. However: they haven’t topped 14th in KenPom in any of these seasons, and they started this parameter of time by missing the Tournament. They’re more good than great. Auburn, meanwhile, went 12-24 in SEC play over the first two years of our search. Objectively, they were bad, and it would’ve taken something heroic to even get them to touch this tier. The Final Four run in 2019 is just enough to push them into Tier 3; their 25-6 record this season belied them being the seventh-luckiest team in all of CBB. (Their “real” record would’ve translated to something like 22-9 and about 10-8…meaning with a less-unusual run of wins in coin-flip games, they could’ve been the sixth-best team in their own conference.)
  • Tier 4: Solid and Reliable. Rare is it that these programs are outright bad, but even rarer is it that they’re truly attention-grabbing. These programs largely have lived for being an 8 or 9 seed with the occasional Sweet Sixteen run. This tied for the largest group at 20 teams deep: Kansas State, Marquette, Miami (FL), Virginia Tech, Indiana, Clemson, Texas, Notre Dame, Iowa, Syracuse, Providence, TCU, Arkansas, SMU, UCLA, Texas A&M, Oklahoma State, USC, and LSU. None of the top-end teams were serious threats to enter Tier 3, but LSU was a real threat to fall to Tier 5. They would’ve made the NCAA Tournament this year as an 8 or 9 seed, which would be fine…but their first three years of this run resulted in zero NCAAT runs and a 21-33 SEC record. Will Wade is a fantastic coach that will almost certainly get fired for something other than coaching, so I think they’ve done enough to rise into Tier 4. The team that statistically should be here but isn’t is South Carolina. The Gamecocks are a strange case: in the five years of this search, they never went worse than 7-11 in conference and did make the famous Final Four run in 2017. However: that’s their only NCAA Tournament run under Frank Martin, and it’s the only time they’ve ranked higher than 58th in KenPom under him. LSU has two seasons that are better, and even though their lows were much lower than South Carolina’s, they got the nod. South Carolina is solid and reliable, but not in terms of actually being a good Big Six program. One last note: SMU is the only mid-major in this tier, and it sounds ridiculous when you see their last three KenPom finishes: 84th, 107th, 88th. The first two years are what got them here: 16th in their tournament-banned 2015-16 (likely would’ve been a 5 or 6 seed) and 11th in 2016-17.
  • Tier 5: The Murky Middle. Odds are that these teams suffer from one of the following: a mediocre record; few NCAA Tournament appearances; fewer deep March runs; no conference titles. They exist in a weird middle range where they’re not openly bad and not very good. Like Tier 4, this group is 20 teams strong: South Carolina, NC State, Penn State, Alabama, Utah, Mississippi State, Minnesota, Colorado, Arizona State, Georgia, Northwestern, Ole Miss, Georgetown, Georgia Tech, Illinois, Temple, Memphis, UConn, UCF, and Tulsa. A lot of AAC teams slid in at the end. They haven’t ranked as well on KenPom/Torvik, but their overall records were enough to get them in here as opposed to Tier 6. In particular, Tulsa and UConn were problematic cases: both have only been to one NCAA Tournament in the last six years, and neither would’ve made this year’s field. That said, Tulsa did post three 12+ win seasons in the AAC in our search and UConn had four Top 100 finishes. Outside of Tulsa’s 2016-17 and UConn’s 2017-18, neither has really had a truly forgettable season. I’ll allow it.
  • Tier 6: Don’t Buy or Sell, It’s Crap. Generally, this group has few wins of substance and has made no real noise in March. A few of these programs could reasonably be in Tier 5 but didn’t make it for various reasons: a season that tanked their overall stock, a lack of NCAA Tournament runs, or never doing particularly well in conference play. Eleven programs stand in Tier 6: Washington, Nebraska, Vanderbilt, Stanford, Pittsburgh, Wake Forest, St. John’s (NY), Missouri, Oregon State, Rutgers, and California. Quick: do you remember that Cal actually started this five-year search by being a 4 seed in the NCAA Tournament? Also, do you remember that it ended with a double-digit loss to a 13 seed? That’s the kind of stuff we’re looking at. Washington, in particular, had a good case for Tier 5: they’re objectively better at basketball than probably five of the teams up there. However, their awful 2016-17 season tanked their stock, and the fact they haven’t topped 48th in KenPom since 2010-11 really puts a limiting ceiling on how high they can go. They should break into Tier 5 with another top 60ish season in 2020-21; Torvik projects them 42nd. Among this tier, only Stanford (23rd!) and Rutgers (31st) project higher.
  • Tier 7: Despair. Making the Tournament would be a heroic feat for these programs. “Success” is not sustained at all, and is best represented by the occasional .500 record in conference play. Only six teams fell to Tier 7: DePaul, Boston College, Washington State, South Florida, Tulane, and East Carolina. None were serious contenders for Tier 6, and you could easily make the argument that the bottom three teams here are closer to a Tier 8 than a Tier 6. For now, they’re together. South Florida’s 2012 NCAA Tournament bid is the only NCAAT bid this decade among these six programs.

Lots of words! Now, the mid-majors.

The Last Five Years of College Basketball Tiers (Mid-Majors Only)

A quick reminder: Gonzaga cannot really be considered a mid-major anymore; they routinely post top 10 recruiting classes and have poured a ton of money into basketball. In fact, Gonzaga puts more money into their basketball program than half of the Big Six programs. They’re a high-major now. As such: this list includes everyone other than Gonzaga and the AAC.

  • Tier 1: The Mid-Major Blue Bloods. Every year, you can trust these teams to be right at the top of their conference. They’re a yearly NCAA Tournament fixture, and it’s expected for them to make some March noise. These are teams that have routinely graduated from the 13-16 seed treadmill. This group is five teams deep: Saint Mary’s, Dayton, San Diego State, Nevada, New Mexico State, and VCU. Every year, you expect to see these teams in March. While Dayton and San Diego State’s stars are inflated a bit by unusually great 2019-20 seasons, they’re still March regulars and have histories of legitimate success. New Mexico State is the toughest case. They have fewer losses than any other mid-major not named Gonzaga, and a 2019-20 bid would’ve represented their eight NCAA Tournament run in nine years. Despite them not winning a single game in any of those runs, they still get in by virtue of pure dominance of their conference. They’re 80-8 in the WAC since 2014-15. VCU got a real ‘benefit of the doubt’ nod here; they went 8-10 in the A-10 this year and ranked 144th in 2017-18, but all of their six NCAA Tournament bids from 2012-13 onward have been as a 10 seed or higher.
  • Tier 2: The 12-14 Seeds. Tough one to work on here. Some of these teams are more like 11 seeds when they make the Tournament, but they’re not consistent-enough fixtures to be in Tier 1. Generally, these teams are either consistently great in lower-tier conferences or consistently good in the upper echelon (A-10, MWC, WCC) of mid-major land. Not all of these teams make the Tournament every year, but out of this batch of names, you can expect to see several in your bracket yearly. Tough cuts were made here, but we still ended up with 23 teams: BYU, Rhode Island, Belmont, Vermont, Davidson, East Tennessee State, Buffalo, Yale, St. Bonaventure, Boise State, South Dakota State, Utah State, UNC Greensboro, Furman, UC Irvine, Loyola-Chicago, College of Charleston, Stephen F. Austin, Hofstra, Princeton, Akron, Murray State, and Old Dominion. This group was always going to be huge, simply because there’s a much bigger pool of teams to pick from. Belmont and Vermont had the best Tier 1 cases, as both are yearly March fixtures and routinely win their conference…but neither have the March wins to be a blue blood. It is what it is.
  • Tier 3: Good-Not-Greats. Wide swath here: maybe these are teams that are always the fourth-best team in the A-10. Maybe they’re pretty good in a weak conference. Maybe they’re just good in an average conference. Either way, there’s a lot of ’em. I think there’s 41 teams here: Fresno State, San Francisco, Winthrop, Northern Iowa, Harvard, Grand Canyon, Wright State, Montana, Louisiana Tech, Georgia State, UT-Arlington, Northern Kentucky, Wofford, Middle Tennessee, Western Kentucky, Valparaiso, UAB, Illinois State, Penn, Richmond, Southern Illinois, Toledo, Kent State, William & Mary, Liberty, Louisiana-Lafayette, Stony Brook, Northeastern, Marshall, Bucknell, North Dakota State, Hawaii, UC Santa Barbara, Monmouth, Eastern Washington, Lipscomb, Ball State, Oakland, Iona, Texas Southern, Texas State, and Merrimack. Exhaustingly long! Texas State barely slid in at the end – they’re 87-69, but have a pair of sub-.500 finishes in the Sun Belt. Still: three 20+ win seasons speak for themselves, and they should be pretty good again in 2020-21. Merrimack has all of one season of D-1 play to their name, but it was so good that I almost felt required to get them in at Tier 3.
  • Tier 4: “Fine.” Occasionally, one of these teams will have a great season and pop up in your bracket as a 13 seed, but for the most part, they operate outside of the NCAA Tournament. Nothing wrong with that! Generally, you can expect these teams to be consistently solid, and their range of outcomes are pretty easy to nail down. Lots of teams in this one, again: New Mexico, Saint Louis, UNLV, Georgia Southern, South Dakota, Radford, Ohio, Colorado State, George Mason, Cal State Bakersfield, North Florida, Chattanooga, Saint Joseph’s, Chattanooga, Duquesne, Sam Houston State, Weber State, Austin Peay, Bowling Green, Central Michigan, Florida Gulf Coast, Green Bay, Rider, Northern Colorado, Colgate, Towson, Lehigh, Albany, St. Francis (PA), Jacksonville State, Boston University, North Carolina Central, Siena.
  • Tier 5: The Somewhat Murky Middle. These are more on the side of lower-tier A-10/WCC/MWC teams, mid-pack SoCon teams, and higher-end Southland squads. The list: Eastern Michigan, Nebraska-Omaha, Utah Valley, George Washington, Santa Clara, Loyola Marymount, Indiana State, Missouri State, Tennessee State, UNC Wilmington, Gardner-Webb, Abilene Christian, Northern Illinois, IPFW, UNC Asheville, Long Beach State, Seattle, Brown, Drake, Mercer, Texas A&M Corpus Christi, Coastal Carolina, UC Davis, Nicholls State, North Dakota, North Texas, Wagner, UMBC, Portland State, Wyoming, Norfolk State, Navy, Hampton, Saint Peter’s, and Canisius.
  • Tier 6: Below-Average-ish. Sometimes, these teams make the NCAA Tournament, but generally, they aren’t very good. A couple of the teams in this grouping actually have conference titles to their name, but play in a bottom-three conference. Teams like: San Diego, Pacific, Evansville, Little Rock, La Salle, UMass, Pepperdine, Cal State Fullerton, South Alabama, Louisiana Monroe, Lamar, NJIT, Arkansas State, Oral Roberts, New Orleans, High Point, Western Michigan, Morehead State, Prairie View A&M, Elon, UTEP, Delaware, Eastern Illinois, Fairfield, Tennessee-Martin, Campbell, Montana State, FIU, LIU Brooklyn, Fairleigh Dickinson, Army, Idaho, Robert Morris, Southern, Hartford, Illinois-Chicago, Mount St. Mary’s, and Sacred Heart.
  • Tier 7: Forgettable Squads. To be honest, I spend months, even years without remembering the existence of these squads. They’re not truly the lowest of the low, but seasons with serious success are very rare. UMKC, Columbia, Western Carolina, Air Force, Cornell, Miami (OH), UTSA, Eastern Kentucky, New Hampshire, Southern Miss, Rice, Troy, Tennessee Tech, Florida Atlantic, Charlotte, Fordham, UT Rio Grande Valley, Samford, Southeastern Louisiana, Denver, Charleston Southern, Jacksonville, Appalachian State, IUPUI, Alcorn State, Milwaukee, Grambling State, Sacramento State, Dartmouth, Jackson State, Bethune-Cookman, James Madison, UMass Lowell, North Carolina A&T, Quinnipiac, American, Manhattan, Morgan State, and Loyola (MD). 
  • Tier 8: Basement. I feel bad, because no one should be given this designation; any of these teams can make the NCAA Tournament with a bit of March luck. That said, luck doesn’t seem very realistic for many of them. Dartmouth, Houston Baptist, Northwestern State, North Alabama, Western Illinois, Central Arkansas, Youngstown State, Cal State Northridge, McNeese State, Detroit, Portland, Idaho State, Incarnate Word, Drexel, UC Riverside, Holy Cross, South Carolina State, Southern Utah, Lafayette, Niagara, Citadel, St. Francis (NY), San Jose State, Cleveland State, Stetson, Cal Poly, Southeast Missouri State, Presbyterian, VMI, Kennesaw State, Binghamton, Alabama State, Florida A&M, USC Upstate, Northern Arizona, Bryant, SIU Edwardsville, Longwood, Arkansas Pine Bluff, Coppin State, Maryland Eastern Shore, Howard, Marist, Central Connecticut, Maine, Chicago State, Alabama A&M, Mississippi Valley State, and Delaware State. Apologies to all programs involved.

Hopefully, this gives us a better picture of both a long-term and short-term view of college basketball. If you were to extend the range to ten years for your search, I think it could produce somewhat different results, but you’re also theorizing that a current 18-year-old recruit was intently watching college basketball at 8-12 years old. (As someone who has loved basketball for most of my life, I didn’t start watching college basketball beyond occasional March games until age 10, and even that felt advanced.) This should provide a better, more reasonable view of how things look to the current recruiting class.