College Basketball Watchability Above Replacement (CBBWAR): A new-old way to find the NCAA’s most entertaining teams

I think anyone who’s read my writing on Tennessee basketball can tell that over the course of the last month, the writing itself has grown more…negative? Cynical? Downward-looking? Over it? I’m not sure what the phrase is, but I’ve had a couple of people reach out with suggestions like “watch other teams.” I appreciate said suggestion, as I already do watch other teams, but that idea became rooted in my head as something I’d like to explore.

Long ago on Fangraphs, a baseball statistics site, writer Carson Cistulli created NERD, “an attempt to summarize in one number (on a scale of 0-10) the likely aesthetic appeal or watchability, for the learned fan, of a player or team or game.” I like baseball, but I realized about ten years ago that what I really love is postseason baseball. Regular season baseball…it’s 162 games, man. But instead of giving up on 162 games entirely, I loved reading Cistulli’s NERD reports every day, pinpointing the most interesting games of the week.

Cistulli left NERD (and Fangraphs) behind a few years ago, but the formula remains out there. I copied it to run my own sort of NERD for MLB this season, with a few tweaks (higher emphasis on homers, because homers) and new calculations. It selected the Los Angeles Dodgers, Toronto Blue Jays, and Tampa Bay Rays as the three most watchable baseball teams of 2021, which, yeah. (Braves fans: you were fifth. I imagine that if Weighted NERD existed, you would probably be top four or top three.)

Anyway, this is a long way of getting to the point: I’ve workshopped a similar idea for college basketball. Ensuring that all 359 team ratings are 100% accurate is borderline impossible, because 1) I have a day job and 2) As such, I’m unable to watch a lot of teams until they either play the team I cover or they’re on a network that everyone can agree on. I watch a lot of college hoops, but Sean Paul (not the singer) and others are whooping me in this regard.

To make up for this, I’ve devised a metric I’m loosely calling College BasketBall Watchability Above Replacement (CBBWAR). The name could be changed, but it’s a name that describes the point of the project and the acronym makes it sound like something that will get $41 billion dollars in military funding somehow. Here are the components involved, all sourced from either KenPom or Hoop-Math:

  • Tempo (alternately possessions per game)
  • KenPom Adjusted Offensive Efficiency (Adj. OE)
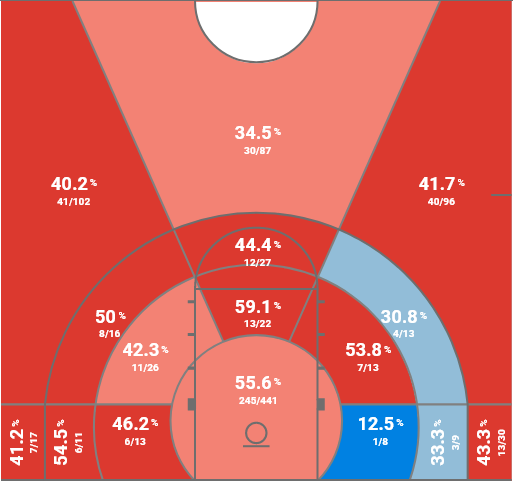
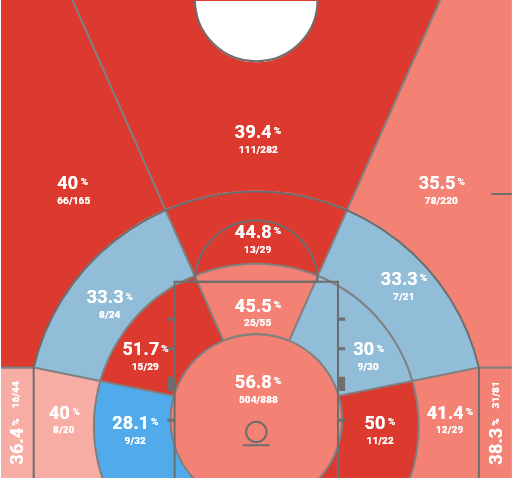
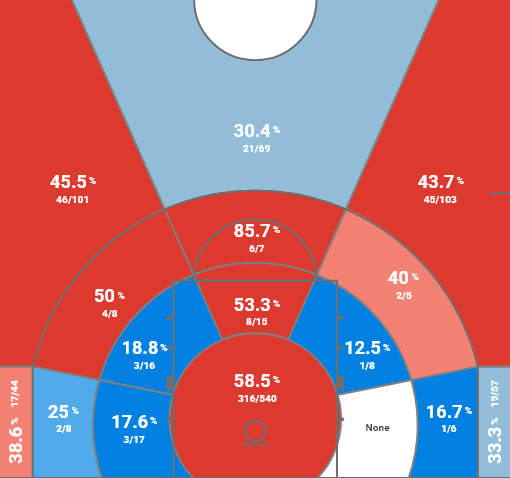
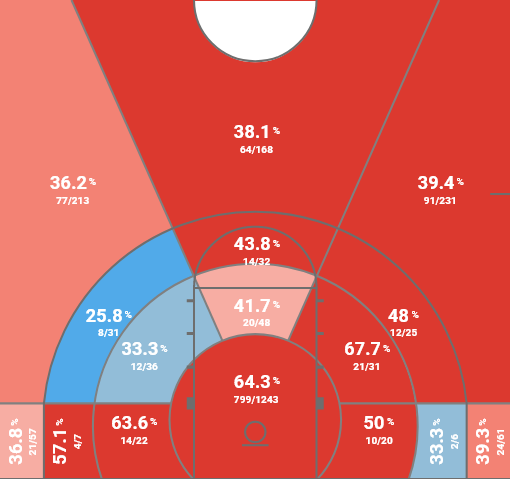
  • Effective Field Goal Percentage (eFG%)
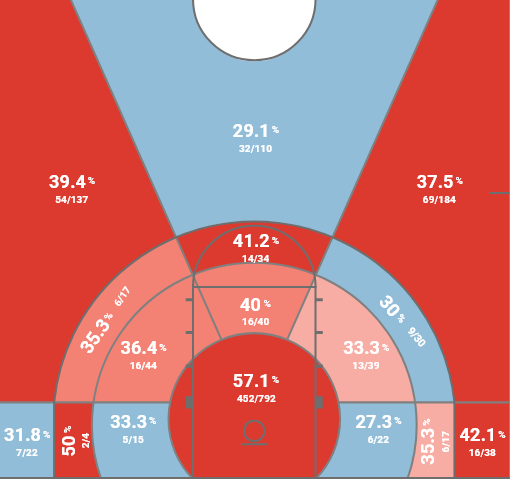
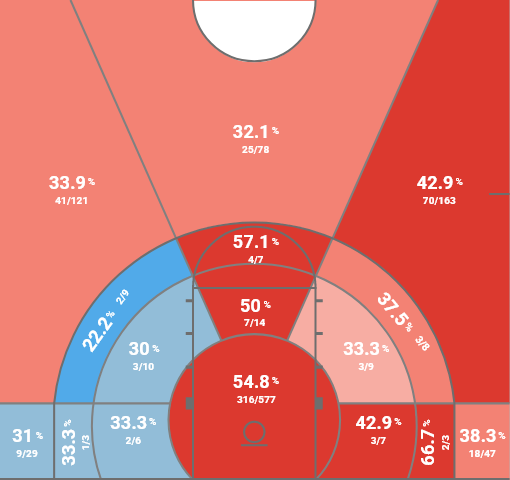
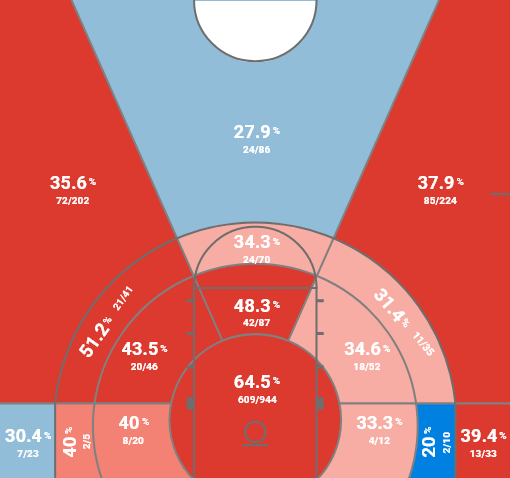
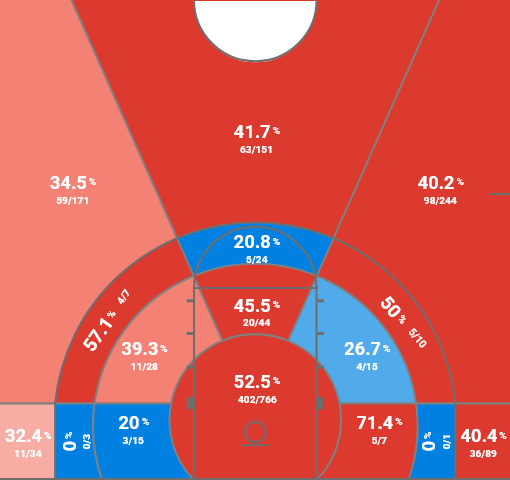
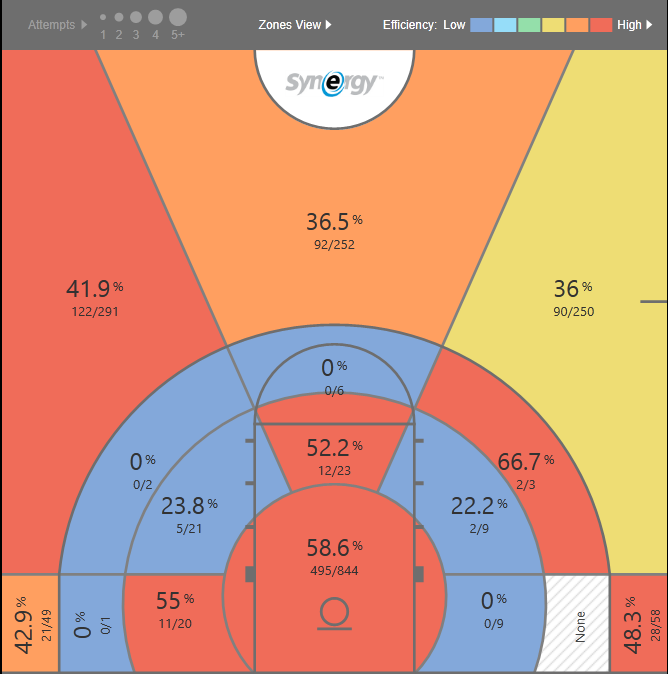
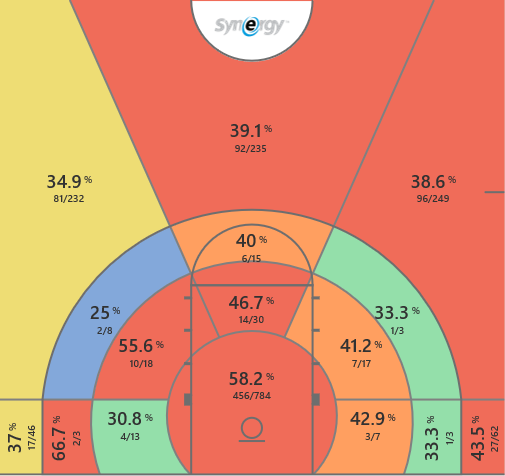
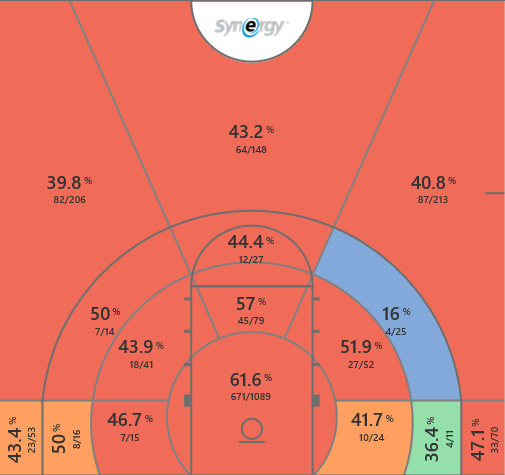
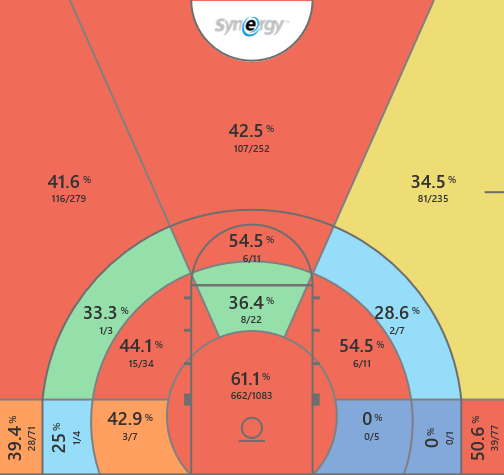
  • Percentage of Shots That Are Long Twos (Mid%)
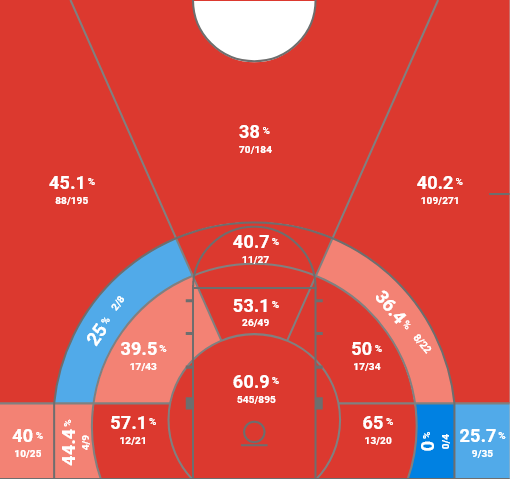
  • FG% at the Rim (Rim%)
  • Three-Point Efficiency (3PT%)
  • Defensive Block Rate (Block%)
  • Defensive Steal Rate (Steal%)
  • Three-Point Attempt Rate (3PA%)

Here’s how these components are currently weighted in my Excel sheet:

Tempo*0.5 + OE + eFG*1.5 – Mid*0.5 + Rim*0.5 + 3PT%*.75 + Block*0.5 + Steal*0.5 + 3PA*0.25 + Constant (currently 2.2, a completely arbitrary number to provide us with higher-rated teams)

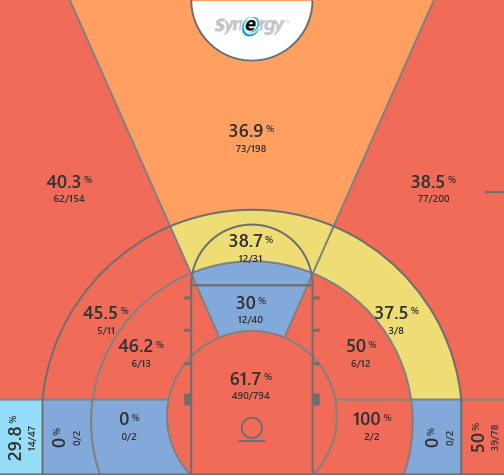
What this roughly comes out to is an equation that values offense at 75%, defense about 18%, and tempo 7%. I like fast games, but I like seeing shots go in the net more. I do not like watching a bunch of mid-range twos by teams that generally cannot hit them. (Consider that the NBA average on a mid-range shot this season is 40.3%; in college basketball, it’s 36.9%, and only 21% of teams in America shoot at 40.3% or better. Thanks, but no thanks.) I like when teams hit threes. Also, I like when teams create havoc on defense by blocking a bunch of shots and forcing turnovers.

Unsurprisingly, eFG% and Adj. OE have the strongest correlation to a higher CBBWAR score at +0.94 and +0.86. Of the defensive stats, blocks (+0.30) have a higher correlation to watchability than steals (+0.10), which makes sense, because really good blocks are freaking cool. Tempo makes very little of a difference, which is ideal.

Your personal formula is probably different, which is fine. No two watchability metrics would ever be the same. But for me, this makes sense, and maybe it will for you, too. This metric is a work in progress, so don’t be surprised if/when it changes. For now, CBBWAR is what I’m using going forward to figure out which games and which teams are the ones I want to watch the most.

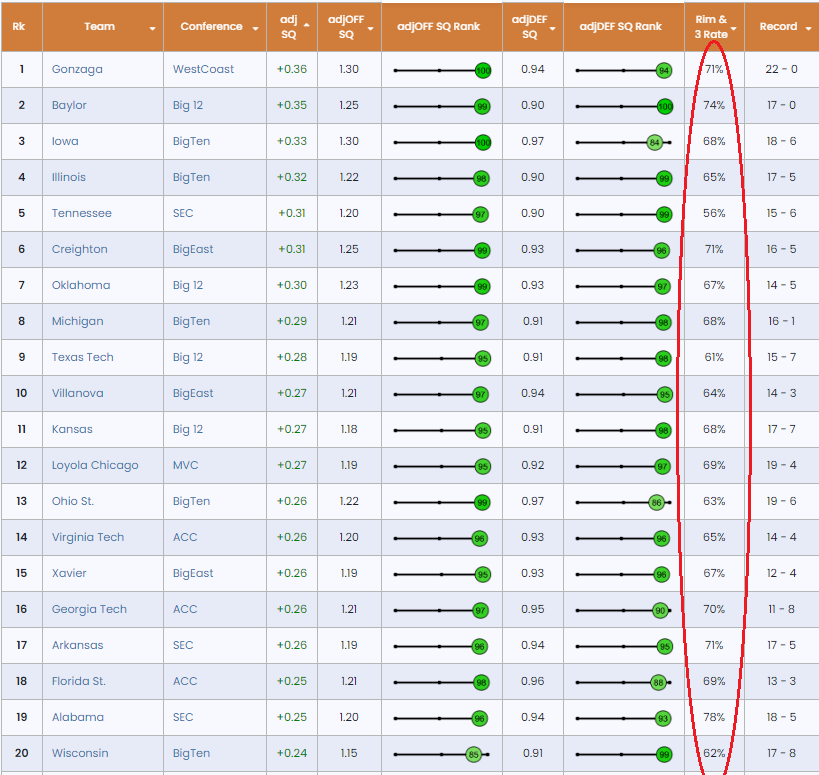
The initial CBBWAR rankings can be scrolled at the sheet below. A version where you can see the individual Z-scores is linked here:

As seen above, here’s the initial top 10 teams:

  1. Gonzaga (+14.19)
  2. Purdue (+12.5)
  3. Arizona (+11.48)
  4. Kansas (+10.56)
  5. South Dakota State (+10.15)
  6. Auburn (+10.08)
  7. Duke (+9.83)
  8. Iowa (+9.68)
  9. Davidson (+9.62)
  10. Colorado State (+9.46)

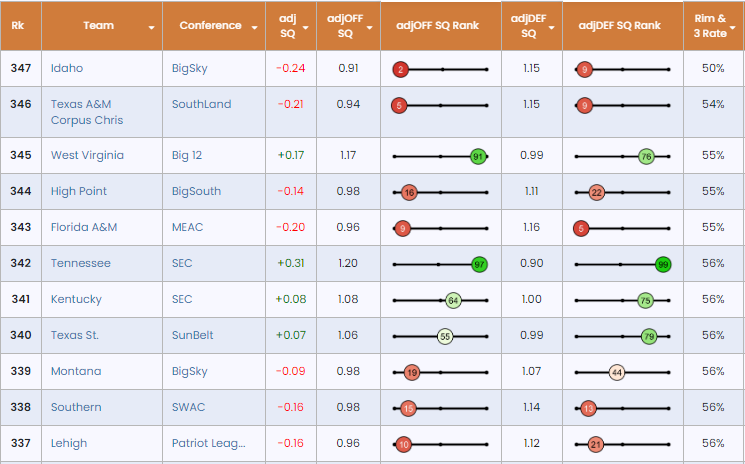
I genuinely like and would approve of this initial draft. To my eyes, I don’t see many teams missing from this top 10 (or top 20, to extend) that would be huge misses. Some of the selections will certainly appear strange, such as a 9-7 Memphis team being 18th overall or Santa Clara, the fifth-best WCC team, being in the top 12. What I would offer is this: no metric is perfect, and these two are early outliers. Still: as someone who isn’t a Memphis fan, this Memphis team is hilarious and amazing to watch. Santa Clara plays fast, scores efficiently, and is one of the best shooting teams in America. I kind of get it.

There are improvements to be made, certainly. I’ll expand on CBBWAR in coming weeks, with more changes after further testing and additional analysis with fair frequency. Hopefully, this gets us closer as a college basketball community to some sort of tool that combines team quality and subjective enjoyment. It will never be perfect or fully satisfactory, but I think it’s a decent start to expand upon.

Lastly, here’s a sheet that will be updated daily with the day’s most watchable games, per CBBWAR.

How much mid-range is too much mid-range?

Hello out there. I hope you’re trying to enjoy the dog days of summer. Every day is exactly the same; an 88-to-93 degree high, a 69-to-73 degree low. Sometimes it rains. Sometimes it doesn’t. Much like basketball, something either goes down or it stays out. This is perhaps the peak time of boredom, something we rarely get anymore with our collective addiction to social media and online life. You can zone out for minutes, even hours and realize that nothing around you has changed all that much. In its own way, it is quite nice.

More than any other time this could possibly be written, mid-August in the middle of Sludge Weather seems like the ideal time to continue the Mid-Range Discourse.

AFTER THE JUMP: The Discourse begins anew

Continue reading “How much mid-range is too much mid-range?”

What matters most in winning college basketball’s closest games?

Sports, in general, lend themselves to classic cliches. The team that continuously wins coin-flip fixtures wants it more. They get the 50/50 plays. Clearly, they have more heart, or perhaps they’re just the more experienced team. Sometimes, we talk about how you can’t let a team like them hang around and how these teams, or players, or coaches, or heck, fans are simply winners. They get it done when it counts.

All of the above are various cliches I’ve heard surrounding close, tightly-contested games. Also, all of the above are cliches I’ve heard across every single sport I watch. The same teams with experience or heart or devil magic seem to exist in all sports, from football to basketball to hockey to European football to curling. They’re everywhere, pervasive at all times, unable to be hidden from. Announcers and sportswriters love cliches like these because they’re narrative-friendly and for the most part, you can’t really disprove them.

How is one supposed to disprove an individual or team having the larger amount of heart, exactly? Do we get postgame MRIs detailing heart girth? Do we get live blood pressure readings in the final moments of a high-leverage situation? Along with that, I’ve never understood how I can say a team didn’t want it more. I mean, I can’t get in their heads or read their inner thoughts. I don’t know if one player is thinking about wanting to take the last shot or throw the final pitch while another is thinking about Arby’s.

Basketball, particularly of the college variety, could be the best testing grounds for all sorts of ideas and philosophies. Are there certain statistical elements that lend themselves to teams winning more close games? Are these elements different in any way from those that decide every other basketball game? Can we actually prove or disprove some of the less airy cliches surrounding basketball’s closeness? I spent a month’s time this offseason diving deep into these questions and more. Whether or not it proves to be of real use, we’ll see.

NEXT PAGE: What defines a close game? What are some of the common stats-unfriendly tropes that can be proven or disproven?

The best men’s college basketball offenses of 2020-21

This is a simple post. It’s the most efficient men’s college basketball offenses of the 2020-21 season, a continuation of a project I’ve done in years prior

First up, the Synergy Sports section. This one is pretty simple: it’s the 20 best offenses of the season, as determined by a minimum number of possessions (1100 or more). Normally, I don’t really have to filter out many teams, but there was a huge variety in how many games teams were able to play this season thanks to COVID-19. Two of the teams in the top 20 here only played 13 games, while one played 35. We’ve never had that much of a disparity in games played, and hopefully, we’ll never have it again.

Something unusual also happened: there was a four-way tie for 19th, which means this list is 22 teams long instead of 20. I’ve included the extra two, because they shouldn’t be excluded arbitrarily.

The difference between this section and the next is a simple one. Synergy includes offensive rebounds as separate possessions; most other places out there count them as part of the same possession. I’ve included both calculations.

Honorable Mentions: Fairmont State (1.015 PPP), Virginia (1.017), Bellarmine (1.018).

T-19. William Penn University Statesmen (Oskaloosa, IA)

  • Points Per Possession: 1.019
  • Best Play Types (90th-percentile or higher): P&R Ball Handler (93rd-percentile)
  • Percentage of Shots Attempted: 49.7% Rim, 11.6% Non-Rim Twos, 38.7% Threes
  • Shots Made by Category: 68.3% Rim, 45.5% Non-Rim Twos, 32.2% 3PT
  • Tempo: 84.29 possessions (would rank 1st of 347 teams in D-1)

T-19. St. Edward’s Hilltoppers (Austin, TX)

  • Points Per Possession: 1.019
  • Best Play Types (90th-percentile or higher): Isolation (95th), Spot-Up (92nd)
  • Percentage of Shots Attempted: 31.3% Rim, 20.4% Non-Rim Twos, 48.3% Threes
  • Shots Made by Category: 65.4% Rim, 42.3% Non-Rim Twos, 36.9% 3PT
  • Tempo: 72.76 possessions (37th of 347)

T-19. Marietta Pioneers (Marietta, OH)

  • Points Per Possession: 1.019
  • Best Play Types (90th-percentile or higher): Spot-Up (97th), Off-Screen (93rd)
  • Percentage of Shots Attempted: 38.4% Rim, 25.9% Non-Rim Twos, 35.7% Threes
  • Shots Made by Category: 60.9% Rim, 40.7% Non-Rim Twos, 39.5% 3PT
  • Tempo: 74.98 possessions (8th of 347)

T-19. Iowa Hawkeyes (Iowa City, IA)

  • Points Per Possession: 1.019
  • Best Play Types (90th-percentile or higher): Spot-Up (97th), Post-Up (97th)
  • Percentage of Shots Attempted: 35.9% Rim, 24.3% Non-Rim Twos, 39.8% Threes
  • Shots Made by Category: 62% Rim, 38.8% Non-Rim Twos, 38.6% 3PT
  • Tempo: 70.8 possessions (98th of 347)

T-17. Marian Knights (Indianapolis, IN)

  • Points Per Possession: 1.021
  • Best Play Types (90th-percentile or higher): Transition (100th), Post-Up (92nd)
  • Percentage of Shots Attempted: 40% Rim, 26.5% Non-Rim Twos, 33.5% Threes
  • Shots Made by Category: 61.3% Rim, 43.4% Non-Rim Twos, 35.6% 3PT
  • Tempo: 68.9 possessions (183rd of 347)

T-17. Hillsdale Chargers (Hillsdale, MI)

  • Points Per Possession: 1.021
  • Best Play Types (90th-percentile or higher): P&R Ball Handler (98th), Post-Up (97th), Cut (95th)
  • Percentage of Shots Attempted: 44.2% Rim, 20.7% Non-Rim Twos, 35.1% Threes
  • Shots Made by Category: 66.7% Rim, 39.1% Non-Rim Twos, 35.6% 3PT
  • Tempo: 67.8 possessions (233rd of 347)

16. Colgate Raiders (Hamilton, NY)

  • Points Per Possession: 1.033
  • Best Play Types (90th-percentile or higher): Spot-Up (100th), Transition (97th), Cut (90th)
  • Percentage of Shots Attempted: 47.2% Rim, 16.5% Non-Rim Twos, 36.4% Threes
  • Shots Made by Category: 61.3% Rim, 34.5% Non-Rim Twos, 40.5% 3PT
  • Tempo: 72.6 possessions (44th of 347)

T-14. Weber State Wildcats (Ogden, UT)

  • Points Per Possession: 1.035
  • Best Play Types (90th-percentile or higher): Spot-Up (100th), Cut (97th)
  • Percentage of Shots Attempted: 36% Rim, 25.8% Non-Rim Twos, 38.2% Threes
  • Shots Made by Category: 67.3% Rim, 44% Non-Rim Twos, 38.9% 3PT
  • Tempo: 71.5 possessions (78th of 347)

T-14. Dubuque Spartans (Dubuque, IA)

  • Points Per Possession: 1.035
  • Best Play Types (90th-percentile or higher): Spot-Up (97th), Transition (95th), P&R Ball Handler (92nd)
  • Percentage of Shots Attempted: 33.6% Rim, 30.6% Non-Rim Twos, 35.8% Threes
  • Shots Made by Category: 55.2% Rim, 45.8% Non-Rim Twos, 44.6% 3PT
  • Tempo: 74.23 possessions (18th of 347)

13. West Texas A&M Buffaloes (Canyon, TX)

  • Points Per Possession: 1.036
  • Best Play Types (90th-percentile or higher): Transition (94th)
  • Percentage of Shots Attempted: 33.7% Rim, 21.9% Non-Rim Twos, 44.4% Threes
  • Shots Made by Category: 65.2% Rim, 41.3% Non-Rim Twos, 36.6% 3PT
  • Tempo: 75.21 possessions (8th of 347)

12. West Liberty Hilltoppers (West Liberty, WV)

  • Points Per Possession: 1.038
  • Best Play Types (90th-percentile or higher): none; highest Off-Screen (89th)
  • Percentage of Shots Attempted: 45.3% Rim, 14.5% Non-Rim Twos, 40.2% Threes
  • Shots Made by Category: 60.8% Rim, 46% Non-Rim Twos, 36% 3PT
  • Tempo: 82.44 possessions (1st of 347)

11. Liberty Flames (Lynchburg, VA)

  • Points Per Possession: 1.042
  • Best Play Types (90th-percentile or higher): Spot-Up (99th), Transition (96th), P&R Ball Handler (92nd)
  • Percentage of Shots Attempted: 39.2% Rim, 13.3% Non-Rim Twos, 47.4% Threes
  • Shots Made by Category: 61.7% Rim, 45.3% Non-Rim Twos, 39% 3PT
  • Tempo: 64.7 possessions (334th of 347)

10. Charleston Golden Eagles (Charleston, WV)

  • Points Per Possession: 1.048
  • Best Play Types (90th-percentile or higher): Cut (100th), Spot-Up (98th)
  • Percentage of Shots Attempted: 43% Rim, 15.8% Non-Rim Twos, 41.2% Threes
  • Shots Made by Category: 69% Rim, 40.5% Non-Rim Twos, 37.4% 3PT
  • Tempo: 70.7 possessions (102nd of 347)

T-8. Westmont Warriors (Santa Barbara, CA)

  • Points Per Possession: 1.052
  • Best Play Types (90th-percentile or higher): Spot-Up (100th), Transition (98th)
  • Percentage of Shots Attempted: 41.2% Rim, 16.6% Non-Rim Twos, 42.2% Threes
  • Shots Made by Category: 64.4% Rim, 47.6% Non-Rim Twos, 38.4% 3PT
  • Tempo: 78.71 possessions (2nd of 347)

T-8. Huntington University Foresters (Huntington, IN)

  • Points Per Possession: 1.052
  • Best Play Types (90th-percentile or higher): P&R Ball Handler (9th), Transition (97th), Spot-Up (94th), Post-Up (93rd)
  • Percentage of Shots Attempted: 37.9% Rim, 17.8% Non-Rim Twos, 44.3% Threes
  • Shots Made by Category: 63.1% Rim, 52% Non-Rim Twos, 37.1% 3PT
  • Tempo: 74.16 possessions (18th of 347)

7. Dallas Baptist Patriots (Dallas, TX)

  • Points Per Possession: 1.07
  • Best Play Types (90th-percentile or higher): Spot-Up (100th), Post-Up (98th), Transition (91st), P&R Ball Handler (90th)
  • Percentage of Shots Attempted: 39.2% Rim, 16.1% Non-Rim Twos, 44.7% Threes
  • Shots Made by Category: 66.4% Rim, 50.5% Non-Rim Twos, 39.9% 3PT
  • Tempo: 73.84 possessions (22nd of 347)

6. Northwestern College Red Raiders (Orange City, IA)

  • Points Per Possession: 1.071
  • Best Play Types (90th-percentile or higher): Spot-Up (99th), Transition (99th), Post-Up (97th), Isolation (95th)
  • Percentage of Shots Attempted: 40.9% Rim, 21% Non-Rim Twos, 38.1% Threes
  • Shots Made by Category: 69% Rim, 45.3% Non-Rim Twos, 39.2% 3PT
  • Tempo: 72.77 possessions (36th of 347)

5. Lincoln Memorial Railsplitters (Harrogate, TN)

  • Points Per Possession: 1.075
  • Best Play Types (90th-percentile or higher): Spot-Up (97th), Transition (95th), Cut (91st), Hand-Off (91st)
  • Percentage of Shots Attempted: 45.8% Rim, 8.8% Non-Rim Twos, 45.4% Threes
  • Shots Made by Category: 67% Rim, 35.9% Non-Rim Twos, 40.9% 3PT
  • Tempo: 77.35 possessions (2nd of 347)

4. Indiana Wesleyan Wildcats (Marion, IN)

  • Points Per Possession: 1.084
  • Best Play Types (90th-percentile or higher): Cut (98th), Post-Up (98th), Transition (91st)
  • Percentage of Shots Attempted: 48.1% Rim, 19.2% Non-Rim Twos, 32.7% Threes
  • Shots Made by Category: 68% Rim, 43.5% Non-Rim Twos, 37.9% 3PT
  • Tempo: 78.75 possessions (2nd of 347)

3. Gonzaga Bulldogs (Spokane, WA)

  • Points Per Possession: 1.085
  • Best Play Types (90th-percentile or higher): Post-Up (100th), Cut (99th), Transition (97th), P&R Ball Handler (97th), P&R Roll Man (97th)
  • Percentage of Shots Attempted: 48.2% Rim, 18.5% Non-Rim Twos, 33.2% Threes
  • Shots Made by Category: 72.6% Rim, 41.5% Non-Rim Twos, 36.8% 3PT
  • Tempo: 74.3 possessions (14th of 347)

2. Lubbock Christian Chaps (Lubbock, TX)

  • Points Per Possession: 1.114
  • Best Play Types (90th-percentile or higher): Everything except P&R Ball Handler and P&R Roll Man were in the 92nd-percentile or higher.
  • Percentage of Shots Attempted: 37.2% Rim, 21.4% Non-Rim Twos, 41.4% Threes
  • Shots Made by Category: 65.9% Rim, 46.8% Non-Rim Twos, 43% 3PT
  • Tempo: 66.7 possessions (#285 of 347)

1. Northwest Missouri State Bearcats (Maryville, MO)

  • Points Per Possession: 1.12
  • Best Play Types (90th-percentile or higher): Literally every single play type that isn’t putbacks.
  • Percentage of Shots Attempted: 42.1% Rim, 11.5% Non-Rim Twos, 46.4% Threes
  • Shots Made by Category: 67.6% Rim, 41.9% Non-Rim Twos, 42.2% 3PT
  • Tempo: 65.7 possessions (#317 of 347)

NEXT PAGE: Top 20 via traditional possession calculations

The best women’s college basketball offenses of 2020-21

This is a very simple post. It’s a list of the most efficient women’s college basketball offenses this season, and it’s a list I’ve made in years prior. This year, I cut the list from 25 down to 20 for one simple reason: COVID-19 and a lower number of games than normal.

There will be two calculations included here. The first, and the one I note in tweets, is from Synergy Sports, which accumulates stats from every single college basketball program in America. Their points per possession numbers will look smaller than most for one specific reason: Synergy notes offensive rebounds as separate possessions. Most others (i.e. KenPom, StatBroadcast, etc.) do not.

First up, Synergy. This one is pretty simple: it’s the 20 best offenses of the season, as determined by a minimum number of possessions (1100 or more). Normally, I don’t really have to filter out many teams, but there was a huge variety in how many games teams were able to play this season thanks to COVID-19. Hopefully, this is the only season we’ll ever have to filter out teams again.

20. Minnesota-Duluth Bulldogs (Duluth, MN)

  • Points Per Possession: 0.93
  • Best Play Types (90th-percentile or higher): P&R Ball Handler (99th-percentile), Spot-Up (97th), Post-Up (93rd)
  • Percentage of Shots Attempted: 39.5% Rim (0-4 feet from the rim), 28% Non-Rim Twos, 32.5% Threes
  • Shots Made by Category: 55.9% Rim, 38.2% Non-Rim Twos, 36% 3PT
  • Tempo: 66.03 possessions

19. Taylor University Trojans (Upland, IN)

  • Points Per Possession: 0.932
  • Best Play Types (90th-percentile or higher): Spot-Up (100th), Post-Up (94th), P&R Ball Handler (92nd)
  • Percentage of Shots Attempted: 31.5% Rim, 14.8% Non-Rim Twos, 53.7% Threes
  • Shots Made by Category: 61% Rim, 36.7% Non-Rim Twos, 37.1% 3PT
  • Tempo: 72.39 possessions

18. Colorado State Rams (Fort Collins, CO)

  • Points Per Possession: 0.933
  • Best Play Types (90th-percentile or higher): Transition (99th), P&R Ball Handler (96th)
  • Percentage of Shots Attempted: 31.5% Rim, 35.5% Non-Rim Twos, 33% Threes
  • Shots Made by Category: 59.3% Rim, 37.7% Non-Rim Twos, 37.7% 3PT
  • Tempo: 73.83 possessions

17. Central Michigan Chippewas (Mount Pleasant, MI)

  • Points Per Possession: 0.934
  • Best Play Types (90th-percentile or higher): Transition (100th), P&R Ball Handler (99th), Spot-Up (92nd)
  • Percentage of Shots Attempted: 33.2% Rim, 21.1% Non-Rim Twos, 45.7% Threes
  • Shots Made by Category: 62.4% Rim, 39.2% Non-Rim Twos, 35.1% 3PT
  • Tempo: 72.55 possessions

16. Rutgers Scarlet Knights (New Brunswick, NJ)

  • Points Per Possession: 0.936
  • Best Play Types (90th-percentile or higher): Transition (99th), P&R Ball Handler (99th)
  • Percentage of Shots Attempted: 37.2% Rim, 30.7% Non-Rim Twos, 32.1% Threes
  • Shots Made by Category: 63.4% Rim, 37.2% Non-Rim Twos, 36.1% 3PT
  • Tempo: 68.27 possessions

T-14. Stanford Cardinal (Palo Alto, CA)

  • Points Per Possession: 0.937
  • Best Play Types (90th-percentile or higher): Transition (97th), P&R Ball Handler (97th), Cut (94th), Spot-Up (91st)
  • Percentage of Shots Attempted: 40.3% Rim, 23.7% Non-Rim Twos, 36% Threes
  • Shots Made by Category: 57.6% Rim, 39.2% Non-Rim Twos, 37.6% 3PT
  • Tempo: 69.81 possessions

T-14. New Mexico Lobos (Albuquerque, NM)

  • Points Per Possession: 0.937
  • Best Play Types (90th-percentile or higher): Off-Screen (99th), Cut (93rd), Spot-Up (90th)
  • Percentage of Shots Attempted: 33.5% Rim, 20.8% Non-Rim Twos, 45.7% Threes
  • Shots Made by Category: 61.5% Rim, 42.5% Non-Rim Twos, 32.9% 3PT
  • Tempo: 76.06 possessions

13. Louisville Cardinals (Louisville, KY)

  • Points Per Possession: 0.939
  • Best Play Types (90th-percentile or higher): Transition (97th), P&R Ball Handler (97th)
  • Percentage of Shots Attempted: 35.9% Rim, 30.4% Non-Rim Twos, 33.7% Threes
  • Shots Made by Category: 61.6% Rim, 39.6% Non-Rim Twos, 34.7% 3PT
  • Tempo: 70.16 possessions

12. Westminster College Lady Griffins (Salt Lake City, UT)

  • Points Per Possession: 0.944
  • Best Play Types (90th-percentile or higher): Post-Up (99th), Cut (99th), Spot-Up (95th), P&R Ball Handler (92nd)
  • Percentage of Shots Attempted: 41.3% Rim, 26.3% Non-Rim Twos, 32.4% Threes
  • Shots Made by Category: 58.8% Rim, 43% Non-Rim Twos, 36.4% 3PT
  • Tempo: 66.31 possessions

11. North Carolina State Wolfpack (Raleigh, NC)

  • Points Per Possession: 0.946
  • Best Play Types (90th-percentile or higher): P&R Ball Handler (98th), Spot-Up (96th), Transition (94th)
  • Percentage of Shots Attempted: 39.8% Rim, 28.3% Non-Rim Twos, 31.9% Threes
  • Shots Made by Category: 61.4% Rim, 39.2% Non-Rim Twos, 36.3% 3PT
  • Tempo: 71.61 possessions

10. Sterling College Warriors (Sterling, KS)

  • Points Per Possession: 0.948
  • Best Play Types (90th-percentile or higher): Transition (98th), P&R Ball Handler (97th)
  • Percentage of Shots Attempted: 40.6% Rim, 35% Non-Rim Twos, 24.4% Threes
  • Shots Made by Category: 57.5% Rim, 43.2% Non-Rim Twos, 39.2% 3PT
  • Tempo: 78.23 possessions

9. Drury Panthers (Springfield, MO)

  • Points Per Possession: 0.956
  • Best Play Types (90th-percentile or higher): Transition (100th), Hand-Off (94th)
  • Percentage of Shots Attempted: 36.8% Rim, 35.6% Non-Rim Twos, 27.6% Threes
  • Shots Made by Category: 63.4% Rim, 41.7% Non-Rim Twos, 34.7% 3PT
  • Tempo: 74.97 possessions

8. Lubbock Christian Chaps (Lubbock, TX)

  • Points Per Possession: 0.963
  • Best Play Types (90th-percentile or higher): Spot-Up (100th), Transition (97th), Post-Up (95th)
  • Percentage of Shots Attempted: 41.9% Rim, 18.3% Non-Rim Twos, 39.8% Threes
  • Shots Made by Category: 58.2% Rim, 40.7% Non-Rim Twos, 36.7% 3PT
  • Tempo: 70.13 possessions

7. Bryan College Lions (Dayton, TN)

  • Points Per Possession: 0.964
  • Best Play Types (90th-percentile or higher): Transition (100th), Spot-Up (96th), P&R Ball Handler (94th), Cut (92nd)
  • Percentage of Shots Attempted: 46.7% Rim, 13.1% Non-Rim Twos, 40.2% Threes
  • Shots Made by Category: 56.9% Rim, 39.2% Non-Rim Twos, 37.2% 3PT
  • Tempo: 79.71 possessions

6. Arkansas Razorbacks (Fayetteville, AR)

  • Points Per Possession: 0.975
  • Best Play Types (90th-percentile or higher): Spot-Up (100th), Hand-Off (96th), P&R Ball Handler (94th), Transition (91st)
  • Percentage of Shots Attempted: 34.7% Rim, 26.5% Non-Rim Twos, 38.8% Threes
  • Shots Made by Category: 57.5% Rim, 33.8% Non-Rim Twos, 38.4% 3PT
  • Tempo: 76.64 possessions

5. Connecticut Huskies (Storrs, CT)

  • Points Per Possession: 0.986
  • Best Play Types (90th-percentile or higher): Transition (98th), Cut (97th), Post-Up (95th), P&R Ball Handler (95th), Spot-Up (90th)
  • Percentage of Shots Attempted: 46.3% Rim, 22% Non-Rim Twos, 31.7% Threes
  • Shots Made by Category: 67.3% Rim, 51.7% Non-Rim Twos, 35.4% 3PT
  • Tempo: 71.4 possessions

4. Florida Gulf Coast Eagles (Fort Myers, FL)

  • Points Per Possession: 0.988
  • Best Play Types (90th-percentile or higher): P&R Ball Handler (100th), Off-Screen (97th), Cut (96th), Spot-Up (94th)
  • Percentage of Shots Attempted: 37.3% Rim, 7.8% Non-Rim Twos, 54.9% Threes
  • Shots Made by Category: 63.6% Rim, 49.3% Non-Rim Twos, 32.9% 3PT
  • Tempo: 75.56 possessions

3. Cedarville Yellow Jackets (Cedarville, OH)

  • Points Per Possession: 0.993
  • Best Play Types (90th-percentile or higher): Spot-Up (100th), P&R Ball Handler (93rd), Hand-Off (93rd), Transition (90th)
  • Percentage of Shots Attempted: 36.4% Rim, 20.8% Non-Rim Twos, 42.8% Threes
  • Shots Made by Category: 57.4% Rim, 36.7% Non-Rim Twos, 38.8% 3PT
  • Tempo: 75.7 possessions

2. Maryland Terrapins (College Park, MD)

  • Points Per Possession: 1.023
  • Best Play Types (90th-percentile or higher): Transition (99th), Spot-Up (98th), P&R Ball Handler (97th), Cut (97th)
  • Percentage of Shots Attempted: 41.9% Rim, 28.2% Non-Rim Twos, 29.9% Threes
  • Shots Made by Category: 61.4% Rim, 41.2% Non-Rim Twos, 40.2% 3PT
  • Tempo: 74.25 possessions

1. Iowa Hawkeyes (Iowa City, IA)

  • Points Per Possession: 1.034
  • Best Play Types (90th-percentile or higher): Everything but Isolation, Hand-Off, and P&R Roll Man.
  • Percentage of Shots Attempted: 38.1% Rim, 23.4% Non-Rim Twos, 38.5% Threes
  • Shots Made by Category: 65.5% Rim, 45.5% Non-Rim Twos, 40.3% 3PT
  • Tempo: 75.28 possessions

NEXT PAGE: Top 20 teams by traditional possession calculations

Six additional questions answered about Tennessee and mid-range jumpers

If you’re reading this site for the first time, I wrote about 7,000 words on Tennessee’s infatuation with mid-range jumpers last Tuesday and was quite pleased with how it came out. Please read that first before reading this.

I got a lot of great, informational feedback on my mid-range article last Tuesday, and I’d like to thank everyone who responded or shared the piece in whatever way they saw fit. I’ve found myself inwardly cringing every time I see any mid-range jumpshot as of late, which is not a good way to live. In the right hands, the mid-range jumper is a tool that can free up space all over the court for an offense in need of it. If you have multiple excellent mid-range shooters, you’re probably going to have a pretty solid offense on the whole.

The issue, as Tennessee fans have seen this season, is that Tennessee doesn’t really have any. This is not 2018-19, when Grant Williams, Admiral Schofield, and Jordan Bone were knocking shots down. It’s been a parade of bad shot selection, frustrating misses, and what looks like a team-wide case of being locked in a mental pretzel. As a fan, it isn’t fun; as a writer trying to make the team sound interesting, it is very annoying.

Anyway, I got several good follow-up questions, and I thought it might be best to devote an article to answering them. No GIFs in this piece, just words; do prepare yourselves for that.

If you’d like to skip ahead to a question, click below. They’re across the next two pages.

  1. Can you clarify some of the data sources?
  2. Are there any other teams that take more or as many mid-range jumpers as Tennessee?
  3. Has *anyone* been great offensively over the last few years taking this many mid-range jumpers?
  4. Has Tennessee been better/worse efficiency-wise in games where they’ve taken a lot/very few mid-range jumpers?
  5. Can we see shooting splits over first 11 games versus the last 12?
  6. Is it just Tennessee’s stars that do this, or is it the entire team?

NEXT PAGE: Questions 1-3

Tennessee is obsessed with the mid-range jumper. Is this a problem in 2021?

Tennessee has a problem. Well, they have several problems, but you have to take them one at a time.

Tennessee’s offense is broken. It has been for most of conference play, minus a couple spare performances. Tennessee sits at an on-the-dot 1 PPP against SEC opponents, which ranks 11th out of 14 teams. They’ve posted an eFG% of 48.4%, which is 10th-best. They rank 10th in both 3PT% (32.5%) and 2PT% (48.2%). Things are not good. So why aren’t they good when they have the most talented, deep team of Rick Barnes’ tenure?

There are many different factors that go into the goodness or badness of an offense, and I’m not going to pretend to know all of them. But the first and foremost thing to me is a very obvious thing that stands out every time I check Simon Gerszberg’s top 20 teams on Shot Quality:

And something else that stands out when I sort by who gets the lowest amount of their shots directly at the rim or from deep:

It’s time for the mid-range debate in Knoxville again. The Worst Shot in Basketball, as deemed by nerds like me, has long been a staple of every Rick Barnes offense. When it works, as it did in 2018-19, you hear very few complaints about it. When it doesn’t, as it hasn’t in…well, every year but 2018-19, it becomes more and more of a criticism and less of a thing you’re willing to let a more traditional coach have.

For this specific article, I’ve broken down the mid-range debate into nine key questions. There’s three per page on the pages that follow. For this article, I reached out to several coaches I know, multiple analytics pals, and, yes, Jimmy Dykes. It’s very long, but I’ve tried to dive into each corner of the Tennessee Mid-Range Issue that I can possibly find. I hope it’s worth your time and mine.

The nine questions are linked below, or you can just click on page 2 after the bullet points end.

  1. Why does Tennessee take so many mid-range shots?
  2. Has Rick Barnes focused on three-level scoring for his full career? Has this worked for Tennessee (or Texas) before?
  3. Has Tennessee’s offense stopped working because of five-star freshman? John Fulkerson? Personnel shortcomings?
  4. Does Tennessee need more ball screens or modern sets?
  5. Should John Fulkerson (or Olivier Nkamhoua, or E.J. Anosike) have worked on becoming at least an okay three-point shooter?
  6. Does Tennessee hurt itself by putting bad combinations (double-big lineups, two or more non-shooters) on the floor?
  7. Can you still score if you have a big man that can’t shoot?
  8. Is the mid-range jumper a thing of the past for great offenses?
  9. Can you temporarily fix this with a lineup change?

2020 Tennessee high school football playoff projections, round one

Hello, and welcome to a yearly tradition here at Stats By Will dot com: the TSSAA high school football playoff projections. I’m a little surprised to be bringing this back this year, as in early September, I announced my plans to not cover high school football at all this year. Without going into great detail, I’ve taken on more responsibilities in my professional role, and to be honest, I care a lot more about my work in basketball than I really do this. That being said, I do enjoy the fun that projections like these can bring. In particular, the playoff projections are pretty easy to put together each year once the field is set.

This year, there won’t be any class-by-class analysis beyond what I’ve posted on Twitter, which were the class-by-class odds. I’ll put the favorites, second-tier contenders, and darkhorses for each class above the projections here so you can get a grasp on what’s at stake in each class. The game with the highest Quarterfinals swing at risk will be bolded and italicized in each class as well. This is not necessarily the best game, but the one that looks to mean the most to the eventual fields of 8. Other writers, like Tom Kreager and Donovan Stewart, know far more about this stuff than I do, so you should listen to them when it comes to high school football. However, I do enjoy providing this simple service for those that enjoy it.

I’ve made a few tweaks to this year’s playoff projections:

  1. The ratings are a little different mix than usual. This year, I just used Cal Preps and Massey Ratings, as Sonny Moore’s ratings haven’t performed as well as those two in my time using both. Also, for the first time ever, my preseason ratings have a very small say in what you see here. They’re factored in at a rate of about 1.8%, which is miniscule, but has helped the ratings be a very tiny bit more accurate on the whole. (For instance, this probably would’ve made my call on last year’s Monterey/Whitwell game less extreme – by the time the game arrived, Monterey was a 95.8% favorite to win, but Whitwell won. They were the higher-ranked team in preseason by far.)
  2. I’ve added a small amount of extra uncertainty to game-by-game picks. It isn’t much, but it’s enough to reflect that any sports season in COVID times is going to be more unpredictable than usual. I already know of two teams that can’t participate in the playoffs because of contact tracing issues. Also, some teams played six or seven games while others got in their full ten. I’m trying to do the best I can with this abnormally-small sample size.
  3. I gave Alcoa a 30-point boost because otherwise, their fans will protest outside of my home. Not really, they’re simply as good as they always are.

Typically, these projections get around 80% of the games right during the playoffs, but I do expect this year to be a little lower. It’s a strange season, I’ve been told. Also, I think I still owe a guy a T-shirt because the school he played for beat the spread in one of the playoff games. If you are this player, please email statsbywill@gmail.com and I will write something very silly on a shirt for you.

1A

Favorites (20% or higher): South Pittsburg (42.5%)

Second-tier contenders (5% or higher): Gordonsville (15.9%), Moore Co. (9.3%), Fayetteville (8.7%), Huntingdon (7.5%), Lake Co. (7%)

Darkhorses (1% or higher): Coalfield (3.2%), Greenback (1.4%), Monterey (1.3%)

Most likely title game: South Pittsburg vs. Moore Co. (12.1% chance of happening)

  • (R1 #3) Jellico 9 at (R2 #2) Oliver Springs 40
  • (R1 #4) Hancock Co. 0 at (R2 #1) Coalfield 57
  • (R2 #3) Greenback 47 at (R1 #2) Unaka 16
  • (R2 #4) Midway 25 at (R1 #1) Cloudland 24
  • (R3 #3) Sale Creek 11 at (R4 #2) Monterey 38
  • (R3 #4) Whitwell 8 at (R4 #1) Gordonsville 44
  • (R4 #3) Clay Co. 19 at (R3 #2) Copper Basin 22
  • (R4 #4) Byrns [Jo] 5 at (R3 #1) South Pittsburg 46
  • (R5 #3) Huntland 25 at (R6 #2) Collinwood 20
  • (R5 #4) Cornersville 22 at (R6 #1) Huntingdon 32 (49.7% Quarterfinal swing – Huntingdon 41.2%, Cornersville 8.5%)
  • (R6 #3) Wayne Co. 10 at (R5 #2) Moore Co. 37
  • (R6 #4) Hollow Rock-Bruceton Central 8 at (R5 #1) Fayetteville 36

2A

Favorites: Peabody (63.6%)

Second-tier contenders: Watertown (17.4%), Meigs Co. (10.6%)

Darkhorses: Trousdale Co. (2.4%), Lewis Co. (1.7%), McKenzie (1.2%), Bledsoe Co. (1.1%)

Most likely title game: Peabody vs. Watertown (38% chance of happening)

  • (R1 #3) Happy Valley 12 at (R2 #2) Rockwood 23
  • (R1 #4) Cosby 0 at (R2 #1) Meigs Co. 61
  • (R2 #3) Oneida 17 at (R1 #2) Hampton 30
  • (R2 #4) Cumberland Gap 7 at (R1 #1) South Greene 46
  • (R3 #3) Tyner Academy 17 at (R4 #2) Trousdale Co. 34
  • (R3 #4) Tellico Plains 1 at (R4 #1) Watertown 45
  • (R4 #3) Westmoreland 29 at (R3 #2) Marion Co. 38
  • (R4 #4) Cascade 10 at (R3 #1) Bledsoe Co. 30
  • (R5 #3) Eagleville 12 at (R6 #2) Riverside 29
  • (R5 #4) Loretto 13 at (R6 #1) Waverly Central 35
  • (R6 #3) East Hickman Co. 19 at (R5 #2) Forrest 27 (31.2% Quarterfinal swing – Forrest 23.2%, East Hickman Co. 8%)
  • (R6 #4) Scotts Hill 5 at (R5 #1) Lewis Co. 44

3A

Favorites: Alcoa (58.2%), Pearl-Cohn (24.4%)

Second-tier contenders: Red Bank (6.6%)

Darkhorses: Milan (4.6%), Covington (2.9%), South Gibson (2.1%)

Most likely title game: Alcoa vs. Pearl-Cohn (46.2% chance of happening)

  • (R1 #3) Unicoi Co. 17 at (R2 #2) GPittman 42
  • (R1 #4) Johnson Co. 0 at (R2 #1) Alcoa 52
  • (R2 #3) Kingston 30 at (R1 #2) Chuckey-Doak 17
  • (R2 #4) Pigeon Forge 30 at (R1 #1) Claiborne 25
  • (R3 #3) Brainerd 33 at (R4 #2) Smith Co. 18
  • (R3 #4) Signal Mountain 20 at (R4 #1) Upperman 28
  • (R4 #3) York Institute 5 at (R3 #2) Loudon 42
  • (R4 #4) Grundy Co. 0 at (R3 #1) Red Bank 49
  • (R5 #3) East Nashville 29 at (R6 #2) Fairview 17
  • (R5 #4) Stratford 22 at (R6 #1) Stewart Co. 23 (33.5% Quarterfinal swing – Stewart Co. 19.5%, Stratford 14%)
  • (R6 #3) Harpeth 7 at (R5 #2) Giles Co. 38
  • (R6 #4) Camden Central 0 at (R5 #1) Pearl-Cohn 56

4A

Favorites: Elizabethton (36.5%), Tullahoma (33.6%)

Second-tier contenders: Lexington (10.1%)

Darkhorses: Hardin Co. (4.9%), Haywood (4.1%), Anderson Co. (2.7%), Nolensville (2%), Springfield (1.7%), Dyersburg (1.5%), Marshall Co. (1.5%)

Most likely title game: Elizabethton vs. Lexington (15.4% chance of happening)

  • (R1 #3) Sullivan South 24 at (R2 #2) East Hamilton 27
  • (R1 #4) Grainger 13 at (R2 #1) Anderson Co. 39
  • (R2 #3) Howard Tech 14 at (R1 #2) Greeneville 40
  • (R2 #4) East Ridge 1 at (R1 #1) Elizabethton 48
  • (R3 #3) Livingston Academy 12 at (R4 #2) Nolensville 32
  • (R3 #4) Stone Memorial 4 at (R4 #1) Tullahoma 42
  • (R4 #3) Marshall Co. 30 at (R3 #2) Macon Co. 18
  • (R4 #4) Spring Hill 17 at (R3 #1) DeKalb Co. 27
  • (R5 #3) White House-Heritage 11 at (R6 #2) Hardin Co. 38
  • (R5 #4) White House 9 at (R6 #1) Lexington 40
  • (R6 #3) Jackson North Side 25 at (R5 #2) Creek Wood 28
  • (R6 #4) Jackson South Side 10 at (R5 #1) Springfield 34
  • (R7 #3) Dyersburg 37 at (R8 #2) Millington Central 11
  • (R7 #4) Crockett Co. 35 at (R8 #1) Fayette Ware 22 (47.2% Quarterfinal swing – Crockett Co. 40.9%, Fayette Ware 6.3%)

5A

Favorites: Knoxville West (30.6%)

Second-tier contenders: Henry Co. (17.4%), Beech (17.1%), Oak Ridge (9.8%), Powell (8.1%), Summit (5.7%)

Darkhorses: Knoxville Central (4.2%), South-Doyle (1.7%), Hillsboro (1.4%), David Crockett (1.3%), Rhea Co. (1%)

Most likely title game: Knoxville West vs. Henry Co. (18% chance of happening)

  • (R1 #3) Daniel Boone 22 at (R2 #2) South-Doyle 30 (52% Quarterfinal swing – South-Doyle 37.6%, Daniel Boone 14.4%)
  • (R1 #4) Morristown East 13 at (R2 #1) Central 34
  • (R2 #3) Knoxville Halls 26 at (R1 #2) Tennessee 28
  • (R2 #4) Sevier Co. 24 at (R1 #1) David Crockett 44
  • (R3 #3) Powell 35 at (R4 #2) Walker Valley 22
  • (R3 #4) Fulton 21 at (R4 #1) Rhea Co. 29
  • (R4 #3) Soddy Daisy 10 at (R3 #2) Oak Ridge 43
  • (R4 #4) Lenoir City 0 at (R3 #1) Knoxville West 53
  • (R5 #3) Columbia Central 16 at (R6 #2) Gallatin 23
  • (R5 #4) Lincoln Co. 8 at (R6 #1) Beech 39
  • (R6 #3) Hillsboro 29 at (R5 #2) Page 22
  • (R6 #4) Hillwood 10 at (R5 #1) Summit 37
  • (R7 #3) Dyer Co. 32 at (R8 #2) Brighton 24
  • (R7 #4) Clarksville 20 at (R8 #1) Munford 31

6A

Favorites: Oakland (30.1%), Maryville (29.7%)

Second-tier contenders: Ravenwood (12.7%), Bartlett (9.1%), Brentwood (7.1%)

Darkhorses: Dobyns-Bennett (2.6%), Independence (2.3%), Riverdale (2.2%), McMinn Co. (1.6%), Collierville (1.1%)

Most likely title game: Oakland vs. Ravenwood (13.4% chance of happening)

  • (R1 #3) Bearden 18 at (R2 #2) McMinn Co. 38
  • (R1 #4) Science Hill 15 at (R2 #1) Maryville 42
  • (R2 #3) Bradley Central 28 at (R1 #2) Farragut 35
  • (R2 #4) Cleveland 13 at (R1 #1) Dobyns-Bennett 36
  • (R3 #3) Warren Co. 24 at (R4 #2) Mount Juliet 27
  • (R3 #4) Blackman 21 at (R4 #1) Hendersonville 30 (38.5% Quarterfinal swing – Hendersonville 30.8%, Blackman 7.7%)
  • (R4 #3) Wilson Central 12 at (R3 #2) Riverdale 32
  • (R4 #4) Rossview 10 at (R3 #1) Oakland 45
  • (R5 #3) Stewarts Creek 9 at (R6 #2) Ravenwood 43
  • (R5 #4) Cane Ridge 12 at (R6 #1) Brentwood 35
  • (R6 #3) Independence 39 at (R5 #2) LaVergne 12
  • (R6 #4) Franklin 26 at (R5 #1) Smyrna 24

II-A

Favorites: Davidson Academy (64.2%)

Second-tier contenders: University School of Jackson (18.6%), Donelson Christian Academy (9.4%), Nashville Christian (5%)

Darkhorses: King’s Academy (1.3%), Friendship Christian (1%)

Most likely title game: Davidson Academy vs. University School of Jackson (46.6% chance of happening)

  • (E #5) Grace Christian Academy 20 at (W #4) Trinity Christian Academy 37 (14.8% Semifinals swing – Trinity Christian 14.3%, Grace Christian 0.5%)
  • (E #6) Webb Bell Buckle 5 at (W #3) Nashville Christian 45
  • (W #5) Jackson Christian 24 at (E #4) Friendship Christian 33
  • (W #6) Columbia Academy 26 at (E #3) Middle Tennessee Christian 28 (game forfeited by Columbia Academy due to COVID-19)

II-AA

Favorites: Christ Presbyterian Academy (50.8%), Lipscomb Academy (41.7%)

Second-tier contenders: CAK (5%)

Darkhorses: none; Evangelical Christian (0.9%) closest

Most likely title game: Christ Presbyterian Academy vs. Lipscomb Academy (66.9% chance of happening)

  • (W #4) Harding Academy 4 at (W #2) Lausanne Collegiate 46
  • (W #5) St. George’s 6 at (M #1) Lipscomb Academy 45
  • (M #4) Battle Ground Academy 32 at (W #3) Northpoint Christian 12
  • (M #5) Franklin Road Academy 20 at (W #1) Evangelical Christian 31 (55.8% Semifinals swing – Evangelical Christian 46.8%, Franklin Road Academy 9%)
  • (E #3) Webb 19 at (M #3) Goodpasture Christian 30
  • (E #4) Chattanooga Christian 23 at (E #2) Grace Christian 29
  • (E #5) Silverdale Academy 0 at (M #2) Christ Presbyterian Academy 48
  • (E #6) Boyd-Buchanan 12 at (E #1) CAK 41

There are 88 games this week in all; the expected record of these projections is roughly 73-15 (83.1%). We’ll see how they do.

A special best of luck to my former high school, Warren County, who will be playing my little brother’s high school, Mount Juliet. In a true battle for the ages, Warren County has the opportunity to secure their first playoff win since 1983 (!), along with their first nine-win season since 1983. It’s been a historic year, and I sincerely hope they pull this one off.

Good luck to all teams involved, and I’ll be back next Friday morning with more projections.

The best offenses in men’s college basketball, 2019-20

Last year, a couple of weeks after the college basketball season, I made my deep exploration into the best men’s college basketball offenses in 2018-19. It led to a full summer of exploring these offenses in greater detail, complete with interviews with coaches and a whole lot of GIFs and game-watching. I loved doing it; it only makes sense that I would do it again.

This year, I decided to expand the, uh, “search” to the top 25 across all levels. Why? Well, why not. SO: here are the very best college basketball offenses of the last five months. I’m doing this in a few different ways than usual. This particular ranking is from Synergy Sports. However, for last year’s KenPom-style ratings, I’ll include that top 25 on the next page, along with the top 25 half-court offenses. It just felt fair to pay tribute to the service that works for all levels of college basketball.

Per Synergy Sports, here were the 25 best offenses of the 2019-20 men’s college basketball season. Below is each team’s shot chart, their best play types, shooting splits, and tempo, which is calculated via Ken Pomeroy’s equation on the next page.

25. Briar Cliff Chargers (Sioux City, IA)

  • Points Per Possession: 1.036
  • Best Play Types (90th-percentile or higher): P&R Ball Handler (99th-percentile); Spot-Up (97th-percentile); P&R Roll Man (96th-percentile); ranked in 100th-percentile on P&R as a whole
  • Percentage of Shots Attempted: 39% Rim (any attempt within 4 feet of the rim), 12% Non-Rim Twos, 49% Threes
  • Shots Made by Category: 61.6% Rim, 38.5% Non-Rim Twos, 39.2% 3PT
  • Tempo: 70.22 possessions (would have ranked 114th of 353 in D-1)

24. Yeshiva Maccabees (New York, NY)

  • Points Per Possession: 1.037
  • Best Play Types: Spot-Up (99th), Transition (98th)
  • Percentage of Shots Attempted: 45.9% Rim, 16% Non-Rim Twos, 38.1% Threes
  • Shots Made by Category: 65.1% Rim, 46% Non-Rim Twos, 39.6% 3PT
  • Tempo: 78.07 possessions (2nd of 353)

23. Brigham Young Cougars (Provo, UT)

  • Points Per Possession: 1.039
  • Best Play Types: Spot-Up (99th), P&R Roll Man (99th), P&R Ball Handler (97th), Post-Up (92nd), 99th-percentile on P&R as a whole
  • Percentage of Shots Attempted: 26% Rim, 32.5% Non-Rim Twos, 41.5% Threes
  • Shots Made by Category: 69.4% Rim, 44.4% Non-Rim Twos, 42.2% 3PT
  • Tempo: 69.7 possessions (133rd of 353)

22. Western Oregon Wolves (Monmouth, OR)

  • Points Per Possession: 1.04
  • Best Play Types: Spot-Up (99th), Post-Up (93rd)
  • Percentage of Shots Attempted: 39.5% Rim, 17.9% Non-Rim Twos, 42.7% Threes
  • Shots Made by Category: 62.2% Rim, 39.5% Non-Rim Twos, 40.5% 3PT
  • Tempo: 75.33 possessions (7th of 353)

21. Walsh Cavaliers (North Canton, OH)

  • Points Per Possession: 1.041
  • Best Play Types: Transition (97th), P&R Ball Handler (97th), Spot-Up (96th), Isolation (93rd), 95th-percentile P&Rs
  • Percentage of Shots Attempted: 36.8% Rim, 19% Non-Rim Twos, 44.2% Threes
  • Shots Made by Category: 61.3% Rim, 41.9% Non-Rim Twos, 41.3% 3PT
  • Tempo: 70.35 possessions (111th of 353)

20. Gonzaga Bulldogs (Spokane, WA)

  • Points Per Possession: 1.041
  • Best Play Types: Post-Up (98th), P&R Ball Handler (97th), P&R Roll Man (97th), Spot-Up (93rd), 100th-percentile P&Rs, 96th-percentile post-ups
  • Percentage of Shots Attempted: 46.1% Rim, 22.6% Non-Rim Twos, 31.3% Threes
  • Shots Made by Category: 65.2% Rim, 41.3% Non-Rim Twos, 38.6% 3PT
  • Tempo: 72.6 possessions (36th of 353)

19. Dayton Flyers (Dayton, OH)

  • Points Per Possession: 1.041
  • Best Play Types: Cuts (99th), Spot-Up (97th), Transition (97th), 98th-percentile P&R
  • Percentage of Shots Attempted: 40.5% Rim, 20.5% Non-Rim, 39% Threes
  • Shots Made by Category: 71.5% Rim, 44.1% Non-Rim, 37.1% Threes
  • Tempo: 68.0 possessions (233rd of 353)

18. St. John’s Johnnies (St. Joseph, MN)

  • Points Per Possession: 1.042
  • Best Play Types: Spot-Up (98th), Hand-Off (94th), Post-Up (92nd)
  • Percentage of Shots Attempted: 43.6% Rim, 21.2% Non-Rim Twos, 35.2% Threes
  • Shots Made by Category: 63.6% Rim, 44.8% Non-Rim Twos, 38.8% 3PT
  • Tempo: 63.08 possessions (351st of 353)

17. Linfield College Wildcats (McMinnville, OR)

  • Points Per Possession: 1.042
  • Best Play Types: Spot-Up (100th), Transition (95th)
  • Percentage of Shots Attempted: 41.6% Rim, 15.9% Non-Rim Twos, 42.5% Threes
  • Shots Made by Category: 64.9% Rim, 41.7% Non-Rim Twos, 39.1% 3PT
  • Tempo: 76.84 possessions (3rd of 353)

16. Nebraska Wesleyan Prairie Wolves (Lincoln, NE)

  • Points Per Possession: 1.044
  • Best Play Types: Isolation (100th), Cuts (99th), Transition (97th)
  • Percentage of Shots Attempted: 39.8% Rim, 16.8% Non-Rim Twos, 43.4% Threes
  • Shots Made by Category: 67.4% Rim, 45.8% Non-Rim Twos, 35.8% 3PT
  • Tempo: 70.76 possessions (84th of 353)

15. Michigan Tech Huskies (Houghton, MI)

  • Points Per Possession: 1.045
  • Best Play Types: Spot-Up (100th), Cuts (99th), Transition (98th)
  • Percentage of Shots Attempted: 32.9% Rim, 26.5% Non-Rim Twos, 40.6% Threes
  • Shots Made by Category: 61.1% Rim, 40.8% Non-Rim Twos, 43.4% 3PT
  • Tempo: 67.8 possessions (242nd of 353)

14. Bellarmine Knights (Louisville, KY)

  • Points Per Possession: 1.046
  • Best Play Types: Transition (99th)
  • Percentage of Shots Attempted: 42.1% Rim, 23.3% Non-Rim Twos, 34.6% Threes
  • Shots Made by Category: 66.5% Rim, 40.4% Non-Rim Twos, 39.5% Threes
  • Tempo: 66.67 possessions (287th of 353)

13. Lewis-Clark State Warriors (Lewiston, ID)

  • Points Per Possession: 1.048
  • Best Play Types: Spot-Up (99th), Post-Up (97th), 94th-percentile P&R
  • Percentage of Shots Attempted: 37.5% Rim, 17.9% Non-Rim Twos, 44.6% Threes
  • Shots Made by Category: 61.5% Rim, 43.7% Non-Rim Twos, 42% 3PT
  • Tempo: 71.25 possessions (65th of 353)

12. Mount Union Raiders (Alliance, OH)

  • Points Per Possession: 1.049
  • Best Play Types: Spot-Up (99th), Transition (98th), Cut (97th), P&R Ball Handler (94th), 99th-percentile P&R
  • Percentage of Shots Attempted: 40.6% Rim, 18.7% Non-Rim Twos, 40.7% Threes
  • Shots Made by Category: 65.3% Rim, 38.8% Non-Rim Twos, 38.7% 3PT
  • Tempo: 71.66 possessions (56th of 353)

11. Jefferson University Rams (Philadelphia, PA)

  • Points Per Possession: 1.05
  • Best Play Types: P&R Ball Handler (94th), Cuts (94th), Transition (92nd)
  • Percentage of Shots Attempted: 37.8% Rim, 26.1% Non-Rim Twos, 36.1% Threes
  • Shots Made by Category: 65.3% Rim, 39.6% Non-Rim Twos, 41.4% 3PT
  • Tempo: 68.51 possessions (210th of 353)

10. St. Thomas Tommies (St. Paul, MN)

  • Points Per Possession: 1.055
  • Best Play Types: P&R Ball Handler (98th), Spot-Up (96th), Post-Up (96th), 99th-percentile P&R
  • Percentage of Shots Attempted: 38.8% Rim, 13.5% Non-Rim Twos, 47.7% Threes
  • Shots Made by Category: 61.1% Rim, 41.8% Non-Rim Twos, 38% 3PT
  • Tempo: 69.39 possessions (152nd of 353)

9. Morningside College Mustangs (Sioux City, IA)

  • Points Per Possession: 1.057
  • Best Play Types: Cuts (99th), Spot-Up (98th), Post-Up (96th), P&R Ball Handler (92nd), 99th-percentile all post-ups
  • Percentage of Shots Attempted: 48.9% Rim, 15% Non-Rim Twos, 36.1% Threes
  • Shots Made by Category: 64.7% Rim, 43.8% Non-Rim Twos, 39.6% 3PT
  • Tempo: 71.37 possessions (63rd of 353)

8. West Liberty Hilltoppers (West Liberty, WV)

  • Points Per Possession: 1.061
  • Best Play Types: Spot-Up (98th), Hand-Off (94th), Transition (89th)
  • Percentage of Shots Attempted: 45.5% Rim, 16.3% Non-Rim Twos, 38.2% Threes
  • Shots Made by Category: 61.6% Rim, 39.2% Non-Rim Twos, 40.7% 3PT
  • Tempo: 81.03 possessions (1st of 353)

7. Olivet Nazarene Tigers (Bourbonnais, IL)

  • Points Per Possession: 1.063
  • Best Play Types: Post-Up (100th), Spot-Up (99th), Cuts (93rd), Transition (92nd), 97th-percentile P&Rs
  • Percentage of Shots Attempted: 45.7% Rim, 17% Non-Rim Twos, 37.3% Threes
  • Shots Made by Category: 62.8% Rim, 38.6% Non-Rim Twos, 40.2% 3PT
  • Tempo: 75.51 possessions (7th of 353)

6. Marian Knights (Indianapolis, IN)

  • Points Per Possession: 1.065
  • Best Play Types: Transition (96th), Spot-Up (94th)
  • Percentage of Shots Attempted: 43.9% Rim, 21.7% Non-Rim Twos, 34.4% Threes
  • Shots Made by Category: 61.9% Rim, 40.5% Non-Rim Twos, 43.5% 3PT
  • Tempo: 72.53 possessions (37th of 353)

5. Indiana Wesleyan Wildcats (Marion, IN)

  • Points Per Possession: 1.068
  • Best Play Types: Post-Up (100th), P&R Ball Handler (98th), Transition (96th), Cuts (96th), Spot-Up (94th)
  • Percentage of Shots Attempted: 48.7% Rim, 15.1% Non-Rim Twos, 36.2% Threes
  • Shots Made by Category: 65.4% Rim, 46% Non-Rim Twos, 39.3% 3PT
  • Tempo: 75.1 possessions (8th of 353)

4. Nova Southeastern Sharks (Ft. Lauderdale, FL)

  • Points Per Possession: 1.078
  • Best Play Types: Cuts (96th), P&R Ball Handler (93rd), Spot-Up (90th)
  • Percentage of Shots Attempted: 44% Rim, 22.9% Non-Rim Twos, 33.1% Threes
  • Shots Made by Category: 65% Rim, 45.7% Non-Rim Twos, 41.9% 3PT
  • Tempo: 81.51 possessions (1st of 353)

3. Lincoln Memorial Railsplitters (Harrogate, TN)

  • Points Per Possession: 1.081
  • Best Play Types: Spot-Up (99th), Cuts (99th), P&R Ball Handler (99th), 97th-percentile P&Rs
  • Percentage of Shots Attempted: 45.9% Rim, 9.8% Non-Rim Twos, 45.3% Threes
  • Shots Made by Category: 65% Rim, 44.1% Non-Rim Twos, 40.6% 3PT
  • Tempo: 78.32 possessions (2nd of 353)

2. UC San Diego Tritons (San Diego, CA)

  • Points Per Possession: 1.095
  • Best Play Types: Cuts (100th), Spot-Up (99th), Transition (98th), 96th-percentile P&Rs
  • Percentage of Shots Attempted: 33.9% Rim, 13% Non-Rim Twos, 53.1% Threes
  • Shots Made by Category: 68% Rim, 43.5% Non-Rim Twos, 40.1% 3PT
  • Tempo: 69.39 possessions (152nd of 353)

1. Northwest Missouri State Bearcats (Maryville, MO)

  • Points Per Possession: 1.146
  • Best Play Types: Every single play type but P&R Roll Man (82nd) and Hand-Offs (74th). Literally every one.
  • Percentage of Shots Attempted: 42% Rim, 12.9% Non-Rim Twos, 45.1% Threes
  • Shots Made by Category: 62.5% Rim, 46.3% Non-Rim Twos, 45% 3PT
  • Tempo: 64.85 possessions (337th of 353)

NEXT PAGE: Top 25 via traditional possession calculations; top 25 half-court offenses

How the stats would’ve picked this year’s (theoretical) 2020 NCAA Tournament

BIG OL’ EDITOR’S NOTEEverything you are reading, as follows, is a hypothetical simulation. The 2020 NCAA Tournament obviously did not happen, but I’ve pieced together a field that A. seems realistic and B. helps me waste more time by thinking about it.

So, here we are. I don’t know how much everyone reading this has changed their lives to reflect our global issues, but I do think we all should. The NCAA certainly did, and it’s tough to be rational about it, but we have to. That said, this is our time.

Something I’ve done just about every year since I knew what statistics were was create a mock NCAA Tournament bracket before the real one. This bracket would reflect how I would pick every game when the time came simply because I like being prepared. For the 2019 Tournament, I created a Google Doc that had stats for every seed line. All of this, objectively, would sound purely ridiculous to someone who spends less than ~2 months of the year thinking about college basketball. And yet: I got three of the four Final Four teams right and you didn’t. I’m sorry, that’s a ridiculous brag, but I had to fit it in somewhere.

Anyway, that’s a long way of saying that in the midst of the NCAA Tournament uncertainty on Thursday, I decided to create a fake bracket on my lunch break at my day job. The Google Doc for this one is titled “Let’s have some fun,” because it should be. Here’s how I made my field of 68:

  • For the most part, I just took the highest-rated conference champion for the Big Six and assumed no bid thieves. Cincinnati technically won the AAC due to the cancellations, so I let them in without a further simulation.
  • For the other 26 conferences, I ran RAND() functions in Excel based on the likelihood that the best team in each conference would win it. This was to reflect that upsets frequently happen in conference tournaments. As such, we ended up with 11 non-first-place conference tournament winners, which is actually a little lower than you’d expect, but makes sense given our restrictions. To save time, every conference that had a team at >50% to win the conference tournament was given a pass into the field. Seemed fair and seemed realistic; I am not God.
  • At-larges made the field on a combination of their Bracket Matrix average seed and Bart Torvik’s projected average seed. This shifted the field a small amount, but 66 of the 68 teams that would’ve made the Matrix’s field of 68 as an at-large made mine. (Xavier and NC State are in my field, while UCLA and Stanford are not. Sorry to all Pac-12 fans; I can create a contingency bracket if you want.)
  • Lastly, the field was seeded 1-68 on said seeding combination. It feels right, and I like how it turned out.

Enough wailing. Here’s your field. Where necessary, I’ve included an asterisk* where the conference champion was someone other than the 1 seed.

The 2020 Will Warren Invitational Field of 68

  • 1 seeds: Kansas, Gonzaga, Baylor, Dayton
  • 2 seeds: San Diego State, Florida State, Villanova, Michigan State
  • 3 seeds: Creighton, Duke, Maryland, Seton Hall
  • 4 seeds: Oregon, Kentucky, Louisville, Ohio State
  • 5 seeds: Wisconsin, Butler, BYU, West Virginia
  • 6 seeds: Michigan, Auburn, Penn State, Iowa
  • 7 seeds: Virginia, Illinois, Arizona, Houston
  • 8 seeds: Colorado, St. Mary’s (CA), Providence, Marquette
  • 9 seeds: Rutgers, LSU, Florida, Oklahoma
  • 10 seeds: USC, Texas Tech, Indiana, Arizona State
  • 11 seeds: Utah State, Wichita State/Xavier, Cincinnati, East Tennessee State
  • 12 seeds: Richmond/NC State, Yale, Stephen F. Austin, Liberty
  • 13 seeds: Vermont, New Mexico State, Belmont, Western Kentucky*
  • 14 seeds: Bradley*, Hofstra, Northern Colorado*, North Dakota State*
  • 15 seeds: Texas State*, Winthrop*, Northern Kentucky*, Ohio*
  • 16 seeds: UC Santa Barbara*, Boston University*, Siena/North Carolina Central, Robert Morris/Jackson State*

First four out: Stanford, Texas, UCLA, Mississippi State
Next four out: Northern Iowa, Purdue, Arkansas, Oklahoma State

A quick Q&A session, based on questions I would imagine people asking:

  • Why is Baylor the third overall seed? By Kansas winning the Big 12 Tournament here, we’re assuming Baylor now has four losses on the season, which, in my mind, would elevate Gonzaga to the second overall seed. I don’t know, dude, I just did it because I felt like it.
  • Explain Creighton and Duke as 3 seeds. Creighton was white hot down the stretch of the season; Duke was not, but they are named Duke, so we all rightfully expect them to win the ACC. Again, in our simulation, Florida State won it, so a 3 seed feels accurate. Meanwhile, Creighton did win the Big East in this simulation, but Villanova ranked ahead of them. Why? 1. Ask someone who does this for a living I really don’t know. 2. It actually isn’t that absurd; by Wins Above Bubble, Villanova ranks 7th and Creighton 9th.
  • Kentucky as a 4??? Hater! Correct! I do not like Kentucky. Anyway, this is a team that didn’t crack the KenPom top 20 after January and closed the season 12th in WAB. I’m gonna guess that the teams in actual good conferences would’ve gotten the nod ahead of them. Everyone really undersold how awful it was to watch SEC basketball this season.
  • Explain the Last Four In. Again, not God, but a very white guy who’s drinking coffee out of a Charleston Rainbow Row cup as I type. Anyway:
    • Wichita State ranked 31st in WAB, had good metrics across Torvik and KenPom, and, in our simulation, wins at least one AAC Tournament game.
    • Xavier only ranked 46th, but they had no true bad losses (16-2 against Qs 2-4) and had a true marquee win: their 74-62 road victory over Seton Hall in early February.
    • Richmond: 38th in WAB, made the A10 championship game in our simulation. Xavier got the 11 seed nod only because they were in a significantly stronger conference.
    • NC State: On first run, this was Stanford, but then Stanford totally blew it to Cal in their lone Pac-12 Tournament game…which pushed NCSU just over the edge. They ranked almost exactly the same in metrics averages, but NCSU had a slightly better WAB with one additional Q1&Q2 win. I don’t like either team, to be honest.
  • Explain those who got left out. Just discussed Stanford. UCLA had a worse WAB than any of the four who got in and farted around for half the season. Texas did have a good-enough WAB at 39th but left an awful impression on the committee with a Big 12 quarterfinals loss to Texas Tech, another bubble team. Mississippi State lost to Florida in the SEC quarterfinals and had a worse WAB than the four who got in. The only team in Next Four Out that had a realistic case to me was Northern Iowa, who ranked 41st in WAB, but I simply couldn’t imagine a committee rewarding a blowout MVC quarters loss to Drake with even a First Four Out nod, sadly.

Okay! That’s a lot of words! You came here for a bracket.

The Will Warren 2020 Invitational Bracket

right-click and hit Open in New Tab to see this image made in Microsoft Paint

if you’d like to jump somewhere specific, click below please:

NEXT PAGE: Bracket breakdowns