The 2022 NCAA Tournament is possibly the worst offensive tournament in modern history. Why?

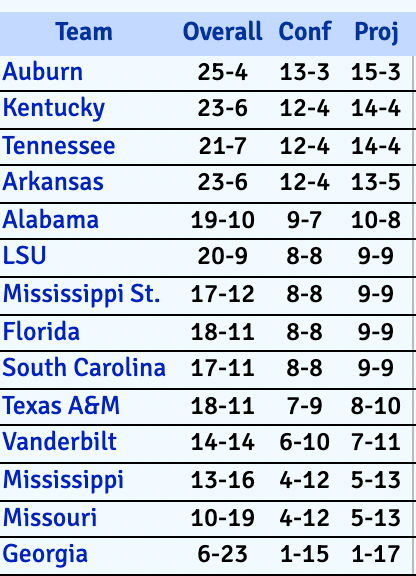
In theory, March Madness should be the happiest time of the year for a website like this. Considering this is the first normal Tournament since 2019 – all games have been played, nothing has been cancelled, and full crowds are allowed in all arenas – it should be a time of celebration. To boot, the 2022 NCAA Tournament has produced 12 upsets (a seed difference of 5 or greater), which will go down as tied for fourth-most in Tournament history barring a North Carolina win or two in the Final Four. Everything should be feeling better. So why have I had this nagging feeling that I’m watching maybe the single worst NCAA Tournament of my lifetime?

Let me explain it this way: of course a site centered around Tennessee basketball complaining about a bad NCAA Tournament is going to sound like sour grapes. But I’ll cut you off at the pass. This analysis is mostly objective, even though I’d also say this has been the least satisfying NCAA Tournament in a long, long time. (TL;DR: Upsets are only useful the first two rounds, and the four remaining teams have a combined 7% likability. I’d trade any of them for Houston, Gonzaga, or even blue blood UCLA.) How could a statistician feel positive about an NCAA Tournament producing stats like these?

There have been 35 NCAA Tournaments since the three-point line was introduced in 1987. The 2022 NCAA Tournament is…

  • 27th in points per game at 68.6 (2012, 65.7);
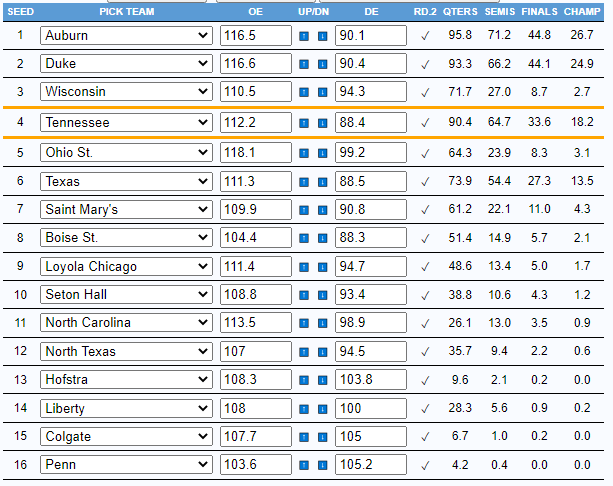
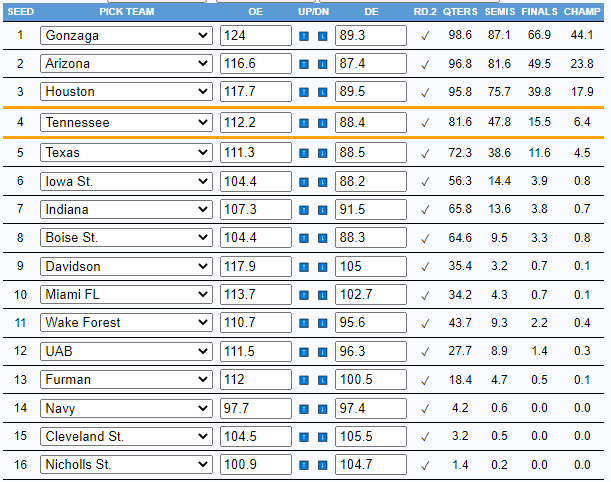
  • 33rd in offensive efficiency (numbers pre-1997 are estimated) at 0.996 PPP (1999, 0.988 PPP);
  • 34th in FG% all time at 42% (1999, 41.9%);
  • 34th in eFG% all time at 47.7% (1999, 47.6%);
  • 34th in Scoring Percentage (i.e., how many possessions end in some amount of points) at 44.5% (1999, 44.2%);
  • and, worst of all, 35th in 3PT% at 31.5%.

The only thing this Tournament has done at an elite level that isn’t a bad elite thing is limiting turnovers (15.5% of all possessions), but that also leads to the lack of excitement. Turnovers are lower than ever and offensive rebounds are similarly at a Tournament-long valley, which means a lack of events. Coupled with the lack of made shots, it’s made for a lot of boring basketball. The median Tournament game has been decided by nine points, which is a hair lower than usual, but this Tournament has also produced eight games where the winner has scored 59 or fewer points. This is all before you get to the usual attractors: no buzzer-beaters, no true Instant Classics after the first day of the Tournament (Arizona/TCU, maybe?), not even many elite players still playing. (Among the 10 players in KenPom’s Player of the Year ballot, just one – Paolo Banchero – is still alive in this Tournament.)

No matter how you slice it, this has been an underwhelming, brick-filled Tournament. Naturally, I had to ask a lot of people smarter than me why. I polled several coaches and media members, giving them anonymity in return for what they thought was the reason for this particularly defense-friendly Tournament. I’ve divided up their responses into five theories, along with a sixth I’ve explored for my own good. Can I promise an answer? Not really. But I can promise that your theory of choice is probably listed on here somewhere, and I have tried to see if it makes sense or not.


Are players taking too many threes?

I’d be interested to know the percentage of threes taken in this tournament compared to past. Maybe too much reliance on the three?

Is the three point attempt rate higher than before?

This one is fairly simple to answer: not really. Actually, for once, three-point attempt rate is going in the other direction. In one aspect, this theory could reasonably be accurate: the 2022 NCAA Tournament has the fourth-highest three-point attempt rate in March since the three-point line was standardized in 1987. That’s pretty big; take a look at the below graph and you’ll see just how big it is.

In fact, you can see a pretty good story with it. In 1994, the 3PA% breached 30% for the first time in March, and it never dipped below 30% again. It held somewhere between 31-34% for 22 years, until finally, in 2016, we hit 35% or higher for the first time. My guess is that it never goes below 35% again. However, you can see that we’ve possibly hit Peak Three with the 2019 NCAA Tournament, the only one to ever have an attempt rate above 40%. This year represents a regression of sorts to the 2016-2017 NCAA Tournaments.

The other intriguing part of this: matching the postseason three-point attempt rate with its larger sample-size brother, the regular season.

There’s a serious part of your story: teams are taking fewer threes in the postseason than they did from November to early March. Three-point attempt rate in March is still pretty close to the regular season rate, but the 2022 NCAA Tournament tells quite the story: only the 2015 NCAA Tournament has a greater decrease from regular season attempt rate to postseason attempt rate. Teams are taking 2.01% fewer threes in March as of now.

In theory, you could explain part of this drop by noting that fewer three-point heavy teams made the field this time around. Among the NCAA’s top 35 teams in 3PA%, only two made the field: Alabama and Villanova. Alabama bombed out early, but Villanova is still playing, so maybe this isn’t the best test case. Still, think of it this way: if you apply that same “top 35 in 3PA%” query to previous years, five Top 35 teams made it in 2021, six in 2019, and five in 2018. We just had an unusual dearth of high-3PA% teams this year. Then again:

Median 3PA% of NCAA Tournament Field, Last Five Years

  • 2022: 37%
  • 2021: 36.9%
  • 2019: 38.5%
  • 2018: 37.3%
  • 2017: 36.4%

If anything, this Tournament should have had marginally more three-point attempts than last year. And yet: that graph above shows it’s the lowest 3PA% since 2017. So: I don’t think it’s the volume of threes, necessarily. Maybe it’s the quality?

Are the wrong players taking the shots?

Players that don’t shoot the three well enough are embracing the revolution by shooting more threes than they typically do . This has caused an influx of three-point attempts, but the percentage of makes across the entire NCAA drops because these new shooters aren’t shooting at a good enough percentage.

Guys who should not be taking threes are taking them.

I’ve broken down the concept of the Right Shooter™ as follows: a player who hit 34% or more of his threes in the regular season (AKA, above the national average of 33.7%) while taking 45 or more (AKA, roughly 1.5 or more a game). That gave us a sample size of 187 players across 68 teams to work with, or roughly 2.67 per team. I think this lines up with a subjective view of the game: the average NCAA Tournament team has about 2-3 guys you’re happy with taking whatever they want to take from three, followed by a lot of coin-flips or no-gos on the rest of the roster.

The best way to compare this is to show what these guys did in the regular season. Across a data set of 187 players, this group went 9428-for-24284 on threes, or 38.8%. Every other three-point attempt by NCAA Tournament teams: 7343-for-23483, or 31.3%. That’s a huge difference: 1.164 points-per-shot versus 0.939. You’d much rather have the Right Shooters take these shots than the Wrong Shooters. Something else you’ll notice is that our Right Shooters took 50.8% of their team’s three-point attempts on average; everyone else got slightly less than half. Again, seems right: 2-3 shooters getting just over half the deep balls tracks mentally.

What’s left to prove, or disprove, is if these splits held up in the 2022 NCAA Tournament. Here’s how it’s held up in March:

  • Right Shooters™: 53.1% of all three-point attempts; 32.9% 3PT%
  • Wrong Shooters™: 46.9% of all three-point attempts; 30% 3PT%

Interestingly, teams’ best shooters are actually taking a hair more of the share of three-point attempts than they did in the regular season, at 53.1% vs. 50.8%. The problem: the best shooters have gone dead cold this March. Collectively, those 187 players, which include some of the best shooters in America, are shooting 5.9% worse in this three-week sample size than they did across the regular season as a whole. It’s the Wrong Shooters that are more in line with expectations, at 1.3% below.

So: it’s not that bad shooters are necessarily taking more shots, really. It’s that the best shooters are failing to produce the best results in the spotlight, and teams frequently have nowhere else to turn. Why could this be so?

Is there more switching defensively/better defense in general?

The defense has been outstanding [this Tournament]. Hard to get open looks. 

Much more switching defensively than in years past both on and off the ball makes it harder to create advantages which generate open looks. Length across the board in college basketball is at its highest level both in standing height and wingspan, which makes everything more difficult, including shooting and finishing.

Yes and no. I think this is pretty hard to measure with straight-up metrics. Subjectively, you could say “yes” and not many people would really blink at it. Per Patrick Stevens, this has been the most defense-friendly Tournament in years:

What makes that stat even worse is that the number is now eight, after Villanova’s 50-44 defeat of Houston, with three games still left to play. The possibility of one final stinker still exists. Stevens only goes back to 2011, but eight sub-60 winners is tied with 2006 for the most Defensive Battles™ in the shot-clock era (36 Tournaments strong). You’re watching the fastest Tournament by average tempo (68.6 possessions per game) since 2003, but simultaneously the lowest-scoring Tournament since 2015. What gives?

A popular theory, among nearly everyone I talked to, is that the defense is just straight-up better this March than usual. There’s a few different ways of looking at this that could help things make sense. If you want to see if more high-end defenses made the Tournament than usual, you can look at this and say…no, actually:

Percentage of Top 30 Defenses That Made NCAA Tournament:

  • 2022: 26/30 (86.7%)
  • 2021: 26/30 (86.7%)
  • 2019: 26/30 (86.7%)
  • 2018: 22/30 (73.3%)
  • 2017: 22/30 (73.3%)

If you prefer the median NCAA Tournament defense:

Median NCAA Tournament Team’s Defensive Efficiency:

  • 2022: 95.9 Adj. DE
  • 2021: 94.1 (!)
  • 2019: 96.6
  • 2018: 98.1
  • 2017: 96.6

You could look at that and say that, yes, this is a pretty strong defensive Tournament. And yet: shouldn’t 2021 have been far more defense-friendly if that were the case? The 2021 NCAA Tournament ranked 19th out of 35 NCAA Tournaments in terms of offensive efficiency; in the KenPom era (2002-pres.), it ranks 14th of 20. Not a great offensive Tournament, really, but certainly better than this one. Along with that, despite having the worst defenses in the sample size, 2018 actually ranks second-worst among the last five Tournaments in terms of efficiency.

One final way of attempting to answer this is through Synergy data. Like anything that requires human eyes to log statistics, Synergy’s data is subjective to the viewer. Still, it’s the best publicly-available database out there that is even somewhat comparable to Second Spectrum for the NBA. The best way of using it for this purpose is to take their Guarded/Unguarded data, as well as what they have for pull-up (off-the-dribble) jumpers, and see what it says.

In the regular season this year, Division I basketball teams shot 32.1% on guarded catch-and-shoot threes, which is any spot-up three where a defender is within four feet on the shot. (Synergy may deem this differently, but it is what I’ve always taken to mean an open vs. contested attempt.) On open catch-and-shoot threes, the D-1 average was 37.4%. Clearly, being open makes a difference: over the course of 100 three-point attempts, you’d hit about five more ‘open’ ones than you would ‘guarded’. Some teams are great (Villanova) or terrible (Wisconsin) at shooting against any sort of guarding, so, again, subjective.

Still, we could use that in three purposes: to determine if teams are simply missing a bunch of catch-and-shoot threes in March, to see if there are more guarded attempts than normal, and to see if teams are getting fewer catch-and-shoot threes period.

Catch-and-shoot threes, regular season versus NCAA Tournament:

  • Regular season: 34.6% 3PT% on all C&S threes; 37.4% open; 32.1% guarded
  • NCAA Tournament: 33.8% 3PT% on all C&S threes; 37.8% open; 30% guarded

Guarded vs. unguarded threes, regular season versus NCAA Tournament:

  • Regular season: 53.4% Guarded, 46.6% Unguarded
  • NCAA Tournament: 52% Guarded, 48% Unguarded

Average number of catch-and-shoot threes per game, regular season versus NCAA Tournament:

  • Regular season: 15.8 combined per game (8.4 Guarded, 7.4 Unguarded)
  • NCAA Tournament: 14.5 combined per game (7.5 Guarded, 7 Unguarded)

There’s a lot to take from this. Firstly, teams are having a horrific time hitting guarded catch-and-shoot threes this March. 30% on guarded ones is what Nevada, who ranked 247th in guarded FG%, shot in the regular season. That’s pretty bad. But the fact that the sport as a whole is down 0.8% on these shots (admittedly in a smaller sample size) is pretty interesting. Along with that, there have been fewer catch-and-shoot attempts in the postseason by a significant margin…but said catch-and-shoot attempts have also been slightly more open.

Subjectively, you could say that this has been a fantastic defensive Tournament, and it would be hard to disagree. At the same time, take a look at Ken Pomeroy’s pre-Tournament rankings on March 15. Zero top 10 defenses made the Final Four. In fact, none of the top 25 did: Villanova, at 28th, was the best defense before the Tournament started to be one of the last four standing. How much does defense matter in terms of stopping opposing threes? Pomeroy’s research, spilled onto this page several times over, notes that teams can prevent three-point attempts, not makes as frequently. The field of 68 has done a good job of this, but it alone would not explain the worst 3PT% in Tournament history.

Is shot selection worse than usual?

I think decision making [this Tournament] is very poor. Kids are trying to finish drives at the rim over length vs. playing off 2 feet and making a play for their teammate on a drive and kick. Tons of tough long twos as well – poor shot selection leads to poor FG%.

Thankfully, this one is a little easier to measure. In the regular season, teams got 35.5% of all shots at the rim, 26.8% in Other Twos territory (not a layup, dunk, or tip-in, but still a two), and 37.7% threes. I’ve done private work in the past for teams that shows the percentage of Other Twos increases by roughly 4% when playing Top 100 opponents versus playing everyone else, and one would expect that to more or less hold in a Tournament that mostly contains Top 100 opponents.

Still: I think this one has real merit. The average attempt at the rim in half-court offense, per Synergy, went down at a 55% rate. (Per Hoop-Math, this is 59.3%, but I don’t have the ability to split by regular season/postseason on there.) In the NCAA Tournament, this conversion rate has fallen to 53.5%. Makes sense; you’re playing tougher opponents in general. Has the theory held up for shot selection?

  • Regular season: Rim 35.5%, 3PA 37.7%, Other Twos 26.8%
  • NCAA Tournament, per CBB Analytics: Rim 32.6%, 3PA 35.7%, Other Twos 31.7%

The CBB Analytics work is of particular note, because it hammers in something that’s felt very real while watching the games. Per their data, 10% of all shots have been 16+ foot two-point jumpers, the least-efficient shot in college basketball. 18.3% of all shots have been two-pointers outside the paint. (There’s an array of runners, floaters, paint jumpers, post-up turnarounds, etc. that fall in the Other Twos category, too.) These rates are +2.6% and +4.6% above their regular season counterparts. So, yes: shot selection has been markedly worse in the NCAA Tournament, about 1-2% worse than what I would’ve personally expected.

And yet: the two-point shooting hasn’t really been the problem. Even despite this downgrade in shot selection, the 2022 NCAA Tournament has produced a 2PT% of 47.9%. That’s down from the last several Tournaments, sure, but it’s also a superior 2PT% to 14 NCAA Tournaments from 1987 to now. In fact, this has more or less been an average Tournament from a two-point perspective. Teams are missing a few more shots at the rim than usual, but it’s been counterbalanced somewhat by about a 0.5-1% over-performance on mid-range twos, per the CBB Analytics data. To sum it up: the shot selection has been bad, but it hasn’t really been the entire reason for this Tournament’s offensive car crash.

Is it the ball?

An issue I think that is crazy in college basketball is the variance in basketballs used: Adidas, Nike, Wilson Evo NXT (NCAAT), Old Wilson Evolution, and Spalding TF-1000. [With regards to the Evo NXT], these balls are pumped up and not broken in for March throughout the season.

This is, by some measure, the hardest one to prove or disprove. I am not there in person feeling the basketball itself, so I cannot tell you if it feels like an outdoor ball or it’s hard to get in a rhythm with. Several reviews online believe this ball to be an upgrade over the previous model (Wilson Evolution), which is the ball I own and love. Considering that basically nobody used this ball in games from November to early March, though, it makes the below trendline pretty troubling.

68 NCAA Tournament teams, regular season, various balls: 35.1% 3PT% on 47,767 attempts
68 NCAA Tournament teams, 2022 NCAA Tournament, Evo NXT ball: 31.5% 3PT% on 2,674 attempts

Now, it’s worth noting that in most NCAA Tournaments, there’s an underperformance of about 1-2% from regular season to postseason. You can explain this in various ways, all of which we’ve tried in the past: better defenses, tougher competition, higher stress, unfamiliar venues. All of those are reasonable. But: to be underperforming that regular season rate by 3.6% is a serious outlier. Did any team foresee this coming?

The only way I can imagine testing this, and it is extremely silly, is to use Getty Images to our advantage. I looked through photos of every team in the field from November to March, looking to see which ones used the Evo NXT in any game this season. (Inspired by a New Mexico State fan sharing a photo from January.) Is this unscientific? Yes, and it leaves smaller schools at a serious disadvantage, because photographers aren’t at their games as frequently. But what other way can you really test this that isn’t me telling you this is the worst 3PT% ever and a massive delta from the regular season?

Of the 68 teams in the field, I could confirm, via at least one photo, that 25 teams used the Evo NXT ball either in the regular season, their conference tournament, or both. That’s just 37% of the field using the ball that 100% of the field uses for three weeks in March, which seems less than ideal. If you split out the 25 teams who did have photographical evidence of experience with the ball versus the 43 who didn’t, here’s how it shook out:

  • Did use the Evo NXT ball prior to the NCAA Tournament: 283-for-894 (31.7%)
  • Didn’t use the Evo NXT ball: 560-for-1780 (31.4%)

Uh…well, that’s all of a 0.3% difference. It’s more that everyone isn’t shooting well versus just the teams that had no experience. Still, I think there’s a great point to be made here. Why are we entering the NCAA Tournament with a ball that over half the field seems to have not used in a game? Why can college basketball not agree on one, or at most two, standardized balls to use over the course of a season? The answer, as always: money.

Is it simply a sample size issue?

No coach or media member mentioned this theory, which is completely fine. All of the five theories above were interesting and worth researching. However, it’s a question I have to ask myself: would I be worrying this much about March Madness if this same sample of play happened over two weeks in November?

All you have to do is look back to the first three days of the season, in fact.

  • November 9-11: 31.6% 3PT%
  • NCAA Tournament: 31.5% 3PT%

But that sort of obscures what we’re talking about here. The trendline of a season’s 3PT% goes up from November to March, and true to form, the last three days of the regular season (March 4-6) saw teams shoot 33.9% from three, which is 2.3% higher than they did in the first three days of the season. So why would it bottom out, seemingly out of nowhere, at a time when teams should be shooting better than usual?

If you just watched the first round of the 2022 NCAA Tournament, you wouldn’t imagine that much of anything was wrong at all. Teams shot 34.2% from deep, about 0.5% above the average of the last 10 years. That’s not a huge leap, but it was surprising. The regular season’s 3PT% of 33.7% is the second-lowest ever since the NCAA began tracking threes at the introduction of the three-point line in 1986-87. This is undoubtedly due to the NCAA moving the three-point line back. The three seasons before the line was moved back a foot: 34.8% from deep. Last three seasons: 33.6%. So there’s that.

But that alone still wouldn’t explain what’s happened, starting in the Round of 32. Across the nine Tournaments directly preceding 2022, teams shot 1.1% better in the Round of 32 than they did in the Round of 64. This has a pretty simple explanation, to me: better teams are alive, and said teams are playing their second game in the arena of a weekend. You’re more familiar with your surroundings. That did not happen this year. In fact, it gave us the worst Round of 32 3PT% performance I can find on record.

Teams shot 29.1% in the Round of 32 this year, the worst single-round performance of either of the first two rounds I was able to find. That, obviously, is not ideal. To go with this, teams have shot about 1.1% worse from deep from the Sweet Sixteen onwards. There are multiple explanations for this that all make sense to me: different venues, tougher defenses, more stress, etc. But it’s still hard to explain the 2022 teams shooting 27.5% from deep in the Sweet Sixteen and Elite Eight.

With the trendlines looking the way they look, one of two things seem like they can happen this coming weekend:

  • It gets worse. The remaining Final Four teams are now moving to another different arena, their third in three weeks. Teams will have likely never shot at this arena before arriving. What’s turned into a truly disastrous shooting performance remains disastrous, as the Final Four teams (expected to shoot 36.1% on threes based on season-long numbers) shoot 32% or worse.
  • It really is a sample size issue and regresses to the mean. You can’t judge everything off of 24 games of data, and the Final Four teams have a reasonable outing in line with previous NCAA Tournament trends: roughly 34-35% from deep across the three games.

Either answer will give us more theories, which leads us back to the initial question of why this happened, which then starts the debate(s) all over again. Have we learned anything? I’m not so sure. But I look forward to learning how this closes up this weekend.

2021-22 Bracketology, Vol. 3: where Tennessee stands, SEC Tournament scenarios, and possible draws

If you missed the previous two editions, here’s Vol. 1 and Vol. 2.

Well, hey: this has been a pretty fun season. I’ve had a decent-enough time writing about it. Now, we get to a month that is either torture or more torture, no matter who you root for.

I promise that March can be, and should be, fun. You’ve just got to let it be fun in the first place. What could be more fun than exploring numerous hypotheticals that may or may not come true? For a stats obsessive like myself, it’s my college hoops prime time: all sorts of scenarios, many of which do not really exist.

Cutting to the chase here because this is a long post: these are the six things I’m covering in today’s article.

  • Where Tennessee stands, bracket-wise, as of March 7
  • Various SEC Tournament scenarios and seeding potentials
  • Partner likelihoods
  • Best 1/2/3/4/etc. seeds to pair with
  • Location likelihoods

This is the same format as Volume 2, which was posted just over a week ago, which makes sense to me. Based on feedback from various readers, I’ve tweaked some of the sourcing here and am trying to incorporate what the Bracket Matrix views as the very best bracketologists, alongside with the stats stuff you already know about. Onward!

Where does Tennessee stand at this moment?

Prior to this weekend, it felt like Tennessee would likely lock themselves in at no worse than a 3 seed by beating Arkansas. I think that still remains the case, but after Duke lost at home to a mediocre North Carolina team and Wisconsin lost at home to a wretched Nebraska side missing a starter, you can start to envision the path to a 2 seed, one that may not even require an SEC Tournament title.

That’s all hypothetical, which we’ll entertain in a bit. For now, Tennessee ranks 11th on the Bracket Matrix seed list. One person requested a seed list that was just the top 10 bracketologists on the Matrix (I’m refusing to use BM for obvious reasons); that has Tennessee as the 10th overall seed, barely a hair behind Purdue for 9th overall. The teams Tennessee has to pass to get a 2 seed, at least from the general consensus, are Purdue (9th) and Villanova (8th). (This is where I note that I am not understanding why Duke is 7th on the seed list.) Wisconsin (11th) and Texas Tech (12th) are also in that mix, but both posted worse losses this weekend alone than anything Tennessee’s done this year.

How does the SEC Tournament affect this?

We’ll cover a variety of different scenarios here:

  • Tennessee goes 0-1 against either Mississippi State or South Carolina, both of which would be Quadrant 2 losses
  • Tennessee goes 1-1 and loses to Kentucky
  • Tennessee goes 1-1 and loses to Alabama
  • Tennessee goes 2-1 and loses to Auburn/Arkansas
  • Tennessee wins the SEC Tournament

Might as well get the worst possible outcome out of the way first.

1. Tennessee goes 0-1, losing to either Mississippi State or South Carolina

Expected impact: Drop of 2 spots on seed curve, per Torvik; 0.6 drop in Average Seed, per INCC Stats
Seed range: 10th-13th overall; 3-4 seed

This, obviously, is the worst scenario. Tennessee posts their first Quadrant 2 loss of the season as the worst possible time, ruining their status as one of just eight teams with zero Q2-Q4 losses. Maybe State jumps into the top 50 as a result, but considering they would likely get plowed by Kentucky immediately after, I doubt it.

The net impact of this one is pretty intriguing, though. Torvik (who is not a bracketologist, just a stats guy) has Tennessee 8th on his site’s seed list right now, so his simulation places a loss to MSU as only costing Tennessee two spots on the seed curve. It even might be preferable to actually being 8th and having to draw Gonzaga as your 1. Even so, that seems rosy, and it’s probably a situation that has Tennessee closer to 12th or even 13th overall.

2. Tennessee goes 1-1, losing to Kentucky

Expected impact: …nothing. Zero change on seed curve, per Torvik; zero change in Average Seed, per INCC Stats
Seed range: 8th-12th overall; 2-3 seed

This is the status quo. The path to a 2 seed would be very dependent on everyone else. Auburn is likely locked in at no worse than a 2; same for Kansas and Kentucky. That leaves two 2 seed spots open for six or so teams. At that point, Tennessee is rooting for at least four of Duke, Wisconsin, Villanova, Purdue, and Texas Tech to fail to improve their resume in some meaningful fashion. The problem is that you become even more dependent on the teams likely ahead of you (the first three) to all really blow it. Duke would have to fail to win an ACC Tournament game; Wisconsin probably would, too. Villanova…maybe 1-1, with that one being a bad loss? Not sure.

Either way, pretty hard to go 1-1, lose to an agreed-upon top five team, and drop below the 3 line. If anything, this probably just solidifies Tennessee’s status as a 3 seed.

3. Tennessee goes 1-1, losing to Alabama

Expected impact: …also nothing. Zero change on seed curve, per Torvik; -0.1 change in Average Seed, per INCC Stats
Seed range: 8th-12th overall; 2-3 seed

This is the same scenario as above, just more annoying because it’s Nate Oats and you’re losing to the wonder boy that directed his team to an SEC Tournament 6 seed. I know we’re including the 8th overall seed (the last 2) as a possibility here but it would feel pretty frail. If you lose to Kentucky by three points or something nobody will care; if you lose to Alabama by three points, it’s a lot less impressive. This would be a 3 seed.

4. Tennessee goes 2-1 and loses to Auburn/Arkansas

Expected impact: +2 change on seed curve, per Torvik; +0.2 change in Average Seed, per INCC Stats
Seed range: 7th-10th overall; 2-3 seed

At this point, you’re really on the line. Even in a scenario where Tennessee is beating Alabama on the way to the title game, that’s an additional Quadrant 1 win at a neutral site, and Alabama would be the highest NET team Tennessee’s beaten away from home. If it’s Kentucky, well, even better.

By process of elimination, one of Wisconsin/Purdue (potentially, both) will fail to win the Big Ten. Texas Tech is third-best in odds to win the Big 12. Duke plays in the worst Big Six conference and lost the same number of conference games as Tennessee. Even if Villanova were to win the Big East, you’re staring down a scenario where Tennessee could very well be no worse than 10th overall, could easily be no worse than 9th, and could potentially slip in as the final 2 seed depending on other outcomes. Not bad.

5. Tennessee wins the SEC Tournament.

Expected impact: 404 file not found
Seed range: 5th-9th overall; 2-3 seed

I mean it has been 43 years, after all. But in the unlikely event Tennessee finally does the thing we have been begging them to for eleven Presidential administrations, the following things will happen in turn:

  1. I will hoot and holler;
  2. Tennessee will be a 2 seed, unless…

So: 5th may even be a little aggressive. I reached out to the guy that runs Delphi Bracketology, and he indicated that it would be very unlikely for anyone below Kentucky (6th overall) to grab that final 1 seed. I would agree with him. Those top six seeds may even be fully locked in, and Kentucky may be unable to fall to 7th or lower.

That said…this would be a Tennessee team with 10 Quadrant 1 wins, zero Q2-Q4 losses, and at least one win over one of the two SEC teams in contention for a 1 seed. It wouldn’t really matter what anyone else would do. Tennessee would pass Duke with relative ease, and we already covered that one of Wisconsin/Purdue will eliminate themselves from 2 seed competition. At that point, as long as neither Wisconsin/Purdue win the Big Ten (again, the most likely scenario) you should be fine. 2 seed, just root for not getting Gonzaga as the 1.

Who do you think Tennessee is most likely to draw?

Well, because I am the protagonist of history and everything is specifically designed to harm me, not you, Tennessee will be drawing the First Four winner of Michigan/Memphis in the Round of 32.

More specifically, there aren’t that many updates from last time. The committee rules state that the top four teams (in seed lines 1-4) from a conference cannot be in the same bracket, meaning Tennessee won’t see any of Auburn/Kentucky/Arkansas until a hypothetical Final Four appearance. You can eliminate them from any bracket designs. Beyond that, Tennessee will have nine potential opponents among their 1-4 seeds: three for each seed line, excluding the one Tennessee is on.

Right now, per the consensus, these are the teams Tennessee is technically allowed to be paired with by seed line. Included are the 3 seeds in the event that Tennessee is not a three:

  • 1 seeds: Gonzaga (WCC), Baylor (B12), Arizona (P12)
  • 2 seeds: Kansas (B12), Duke (ACC), Villanova (BE)
  • 3 seeds: Wisconsin (B1G), Purdue (B1G), Texas Tech (B12)
  • 4 seeds: Providence (BE), UCLA (P12), Illinois (B1G), Arkansas (SEC)

Considering the next team up on the seed list is currently Houston, a team that just got pantsed by Memphis, I feel it’s reasonable to state that no fewer than 12 of those 13 teams will be among the top 16 on Sunday. So: you can feel pretty confident in who you’re looking at here.

Beyond that, you have to consider the other conferences, too. We know that the SEC teams cannot be paired together. Who must the 1 and 2 seeds avoid?

  • Gonzaga: none, unless you don’t want them to play previous opponents Duke or UCLA again
  • Baylor: Kansas (2 seed), Texas Tech (3 seed), and probably Texas (5 seed)
  • Arizona: UCLA (4 seed)
  • Kansas: same as Baylor
  • Duke: just other ACC teams, but the committee may want to avoid Gonzaga and Kentucky rematches
  • Villanova: Providence (4 seed), Connecticut (5 seed)

Attempting to figure out how the committee would actually order these teams is a struggle. My guess is that if Baylor wins it’ll be hard to keep them out of the overall 1 seed, but any other scenario results in Gonzaga as the 1. For the purposes of our simulation (of a sort), we’re going with the following seed order based on top bracketologists:

  • 1 seeds: Gonzaga, Baylor, Arizona, Auburn
  • 2 seeds: Kansas, Kentucky, Duke, Villanova
  • 3 seeds: Purdue, Tennessee, Wisconsin, Texas Tech
  • 4 seeds: Illinois, UCLA, Providence, Arkansas

Along with this, I’m indulging a specific and silly part of the equation: seed list rankings. Technically, Tennessee would be #10 on this list. Duke would be #7, Auburn #4, so on. The goal, in theory, is to create a bracket that totals 34 from these rankings: 1 vs. 8, 9 vs. 16. The problem is that when conferences get involved, it gets pretty difficult to actually do that. This is the most even seed line ranking I could produce:

West Region (34)

  1. Gonzaga (1)
  2. Villanova (8)
  3. Purdue (9)
  4. Arkansas (16)

South Region (34)

  1. Baylor (2)
  2. Duke (7)
  3. Tennessee (10)
  4. Providence (15)

Midwest (lol) Region (34)

  1. Arizona (3)
  2. Kentucky (6)
  3. Texas Tech (12)
  4. Illinois (13)

East Region (34)

  1. Auburn (4)
  2. Kansas (5)
  3. Wisconsin (11)
  4. UCLA (14)

See how it gets jumbled on the final two regions? Because of the prominence of the SEC, Big 12, and Big Ten on the top seed lines, it becomes pretty hard to just slate these teams in an easy order. Still, this is a way of getting to 34 per region. Also, while we’re on this subject, Duke has technically requested to be in the Midwest Region, but that request only works if you’re a 1 seed, which is…unlikely. (Don’t doubt the selection committee to somehow find a way to indulge this, though.)

To answer the original question here, it’s just very dependent on results. Tennessee is technically equally likely to draw any of the nine teams they’re allowed to draw, but depending on where Tennessee falls on the seed curve, they’ll be much more likely to grab one versus another. For instance, if Tennessee does end up 10th in the committee rankings, it’s more likely that they are paired with the 2nd overall seed (Baylor as of now), assuming that there are no conflicts with the 2 or 4 seed. Likewise, Tennessee would be less likely to draw the worst 4 seed (16th overall) unless it’s not possible to fit the bracket evenly otherwise.

Who does Tennessee want to be paired with most and least at each seed line?

This is a modified version of the GOAT/Poop Draw that I’ve done the last few seasons for Tennessee. Instead of building a full region out, though, it seems more useful just to give you a general overview of who’s hot and who’s not at each seed line. (Plus, the last time I did the draws, a guy got very mad at me for the concept of them in the first place. Happy Tuesday, guy!) This is ordered from 1 to 16, just like the real thing. WARNING: because of the nature of one-bid leagues, about half of which see a conference tournament upset of the 1 seed, it will get very wobbly towards the end. Stay with me.

For the purposes of this exercise, we’re sticking with the teams currently slotted to be at those seed lines, per the Matrix consensus.

  • 1 seeds: I mean, as long as you don’t draw Gonzaga (#1 overall by 5.3 points in KenPom), it’s probably agreeable. Whether you trust the metrics is besides the point; I simply think that Tennessee does not have enough roster options in the post-Nkamhoua era to contain both Timme and Holmgren for a full 40. Everyone else is at least rational. If you read into late-season performance, Arizona (#2) has played like the 11th-best team over the last 10 games, and Tennessee is technically allowed to play them again. Not great for a 1 seed. Other than that, uh…Baylor?
    • Also: this is kind of a bad batch for 1 seeds, with three currently sitting at +28 AdjEM or lower. While someone has to make it to the Final Four, the last year where at least three of the four 1s entered at +28 or lower in KenPom was 2014, a year when Florida was the only 1 seed to make the Final Four. Before that: 2006, when no 1 seed made it.
  • 2 seeds: The good news is that, by way of being in the SEC, you cannot draw Kentucky (#3), who is likely to be the highest-ranked 2 seed by some distance. The worst team you can technically draw is Duke (#6), who did just lose at home to a team Tennessee beat by nearly 20. Pardon me if I am more than a little worried at the whistle Coach K, who demands to be feted at every turn, will receive in March. Beyond that, your current options are either Kansas (#9) or Villanova (#10). If Tennessee ends up a 3, hope that Wisconsin (#30) won the Big Ten.
    • Speaking of which: On Wisconsin! Yes, seriously. Over the last 20 years, 17 3 and 4 seeds that ranked outside of the KenPom Top 25 have made it to March. Zero have made it beyond the Sweet Sixteen, and only two have made it to the Sweet Sixteen. You want Wisconsin in your bracket. Promise.
  • 3 seeds: I think I speak for everyone when I say no one wants a Tennessee/Texas Tech (#11) rematch. The other options here are Purdue (#13) and Wisconsin (previously covered, #30), both of whom would be reasonable.
    • Purdue is on pace to enter the Tournament with the nation’s #105 ranked defense. The sample size of teams with sub-100 defenses is predictably low, so I’ve extended it to teams with defenses ranked 90th or worse. This is still just a nine-team sample size, but of nine 1-4 seeds with a sub-90th defense, only one of those teams (2015 Notre Dame) made it beyond the Sweet Sixteen. Five went out by the Round of 32.
  • 4 seeds: I don’t know that any of these are like…truly wretched? But if you’re somehow a 1 seed you don’t really want UCLA (#8, #11 NET) in your bracket. Feels like they’re on a collision course with whoever the last 1 seed is, though. (They can’t draw Arizona, and their resume actually ranks second-strongest among the current four 4 seeds). Illinois (#18) is very hot and cold. If you’re Tennessee and, for some reason, you want your 1 seed to stay intact, root for Providence (#36), who will be the lowest-rated 4 seed since 2011 Vanderbilt (#37; lost in Round of 64) if everything holds.
  • 5 seeds: I know that your most recent impression of Houston (#5!) is that they got blown out by Memphis and that they’re down two starters, but think of it this way: they’ve been down two starters since January 2. Since that time, Bart Torvik’s site ranks them as the fourth-best team in America. It speaks to how good a coach Kelvin Sampson is that this is the case. If anything, as long you’re not a 1 or a 4, you badly want Houston as your 5 seed. Anyway, the other 5 seeds, as constructed, are all pretty dangerous: Texas (#15), Saint Mary’s (CA) (#16), and Connecticut (#20) all have at least one win over a Top 10 team.
    • The concept of all four 5 seeds being…well, 5 seeds (20th or better) would actually be somewhat novel. It’s only happened twice before: 2018 and 2005. In those years, 5 seeds went a combined 7-1 in the Round of 64, produced five Sweet Sixteen teams, and two Final Four teams. That may or may not happen this year, but now you know.
  • 6 seeds: Considering Tennessee’s likely status as a 3 seed, know that you only have two options here, as the other two are Alabama and LSU. Tennessee would not want to draw Iowa (#14), who is kind of bad defensively but top 5 on offense and has All-American Keegan Murray on their team. Tennessee would want to draw Ohio State (#26), a team that feels pretty collapse-ready. Ohio State actually rose to 17th before losing by 13 at home to Iowa on February 19, a loss that kick-started a terrible stretch where they’ve gone 3-4 and lost to Michigan and Nebraska at home.
    • A fun OSU fact: their two closest statistical comps are 2009 California (a 7 seed that got stomped in the Round of 64) and 2011 Arizona (a 5 seed who came a point short of the Final Four). Who knows!
  • 7 seeds: Fraught territory for 2 seeds this year, potentially. No one wants to draw Murray State (#25), a team that has lost once since Thanksgiving (to Auburn) and is scalding-hot. Colorado State (#33) is less metrics-impressive but has several good wins. Meanwhile, USC (#40) has a very thin resume for 25-6 and has fallen off defensively.
  • 8/9 seeds: Again, given Tennessee’s positioning and the general fluidity of these seeds, you probably want the 1 seed to have the toughest possible draw. In that case, you’re hoping your 1 seed has to beat either San Francisco (#21) or San Diego State (#23) to make the Sweet Sixteen. You could also hope for Boise State (#27), another Western team that’s flown well under the radar. A bad draw here would be Michigan State (#43), who is coached by Tom Izzo but has played horrendous basketball for the last six weeks.
  • 10 seeds: If you’re a 2, you don’t want Wake Forest (#34), who is the only 10 seed currently inside the top 40 on KenPom. Everyone else is whatever. Worst offender is Creighton (#70), who ranks a spot below Chattanooga, a team that will be either a 12 or 13 seed.
  • 11 seeds: This is where it gets hairy. 6 seeds are 19-21 versus 11 seeds since the First Four became a thing. I can’t imagine that’s much of a surprise. The 11 seed line has generally turned into the best teams from one-bid leagues + the best messy teams from high-majors. The 6 seed that has to play either Memphis (#28) or Michigan (#31) will be dreading it immensely, as will the corresponding 3 seed that has to play the equivalent of a 7-8 seed. The other 11 seeds are frankly not scary, unless…
  • 12 seeds: Loyola Chicago (#24), just like COVID-19, will never go away fully. I think they probably end up an 11 seed, which is why I’m discussing them immediately…but as of the time of writing, they were the highest-rated 12 seed. You don’t want to play them. The 12 seed you would want is Rutgers (#73), who would be a First Four winner. Also not that into the idea of playing North Texas (#48) if I’m a 5.
  • 13 seeds: WARNING! From here on out, it’s sketchy territory at best; none of the teams mentioned will, at the time of publishing, have won their conference. Anyway, the best 13 seeds this year are all helpfully ranked right next to each other: Vermont (#66) and Towson (#67). Furman (#74) is also close, though by the time you read this they may have lost the SoCon title game. The safest option for 4 seeds this year would be a hypothetical matchup with Princeton (#105).
  • 14 seeds: The good news for 3 seeds: as of now, there shouldn’t be any truly scary 14 seeds. Last year, three 14 seeds entered the Tournament in the KenPom top 100, which was pretty unusual. This year, we might have one, and that’s only if very few conference tournament upsets happen or if New Mexico State (#87) gets underseeded somehow. Other than that, the options are teams like Wagner (#127) or Montana State (#142).
  • 15 seeds: It’s not 100% going to happen, but there’s a potential scenario where multiple teams on the 15 line are rated higher by KenPom than anyone on the 14. Colgate (#125), for instance, is currently tracking for a 15. Similarly, Jacksonville State (#141) could be a little plucky if they can find their way into the field. The 15 seed that went to the Sweet Sixteen last year entered the Tournament 151st, and FGCU entered the 2012-13 dance 124th. Anything can happen, but somewhere around 150th is probably the rough barrier.
  • 16 seeds: It feels pointless trying to project these because they never end up with the teams they start with, but Norfolk State (#165) is actually a little spicy. Considering the average 16 seed enters the NCAA Tournament around 205th-210th, gotta take what you can get.

Where will Tennessee be headed for the first two rounds?

I’ll repost the chart I did last time.

Teams Within 500 Miles of a Site, Per a Website My Brother Sent Me

  • Buffalo, NY (Thu/Sat): Kentucky (440 miles), Purdue (447), Duke (476), Villanova (280), Providence (388), Connecticut (193), Ohio State (290)
  • Fort Worth, TX (Thu/Sat): Kansas (445), Baylor (83), Texas Tech (269), Houston (236), Texas (174), Arkansas (292)
  • Indianapolis, IN (Thu/Sat): Kansas (488), Auburn (496), Kentucky (148), Purdue (62), Duke (474), Tennessee (290), Wisconsin (286), Illinois (113), Ohio State (168), Alabama (435)
  • Portland, OR (Thu/Sat): Gonzaga (294)
  • Greenville, SC (Fri/Sun): Auburn (235), Kentucky (251), Purdue (459), Duke (213), Tennessee (115), Ohio State (355), Alabama (271)
  • Milwaukee, WI (Fri/Sun): Kansas (474), Kentucky (386), Purdue (186), Wisconsin (76), Illinois (203), Ohio State (327)
  • Pittsburgh, PA (Fri/Sun): Kentucky (289), Purdue (364), Duke (330), Villanova (256), Tennessee (376), Illinois (435), Providence (457), Connecticut (236), Ohio State (161)
  • San Diego, CA (Fri/Sun): Arizona (361), UCLA (112), USC (112), Saint Mary’s (CA) (451)

I imagine the selection committee doesn’t have an exact-mile point-to-point chart in the room on Selection Sunday, but they probably have a general idea of which teams prefer which locations based on proximity. It matters, otherwise they’d put Kansas in San Diego or whatever.

Anyway, this is how I think each location shakes out as of now, based on the current top 16. All of these are assigned in order, based on closest available location.

  • Buffalo: Providence, Arkansas
  • Fort Worth: Baylor, Kansas
  • Indianapolis: Kentucky, Purdue
  • Portland: Gonzaga, UCLA
  • Greenville: Auburn, Duke
  • Milwaukee: Wisconsin, Illinois
  • Pittsburgh: Villanova, Tennessee
  • San Diego: Arizona, Texas Tech

Some brief comments:

  • Buffalo could shift based on if Villanova wants that over Pittsburgh, but considering the latter is a shorter drive by about 1:15, I doubt it. However, the committee could make an executive call here. Arkansas fans are rabid, but how many are willing to travel on Buffalo on short notice?
  • Fort Worth is locked in.
  • Indianapolis is probably locked in. The only thing that could change is if Purdue falls behind Tennessee in seeding order or if they pick Milwaukee instead.
  • Portland is half locked-in with Gonzaga. UCLA obviously makes more sense in San Diego, but I made an executive decision to send Tech to its closest remaining location as they’re ahead in the pecking order.
  • Greenville is locked in unless Duke falls beneath Tennessee/decides they’d rather play in Pittsburgh for some reason. Considering Greenville is a four-hour shorter drive, it would be weird to elect to go elsewhere.
  • Milwaukee is locked in unless Illinois falls to the 5 line or Purdue wants to play there instead.
  • Pittsburgh is fluid. Villanova would prefer this over Buffalo, but refer to the Buffalo notes for the issues there. Tennessee would prefer both Greenville and Indianapolis, but both may fill up by the time Tennessee is slotted somewhere. If Tennessee goes to Indianapolis instead, Pittsburgh probably becomes a landing spot for a helpless 4 seed…like Arkansas!
  • San Diego is half-locked in with Arizona. Texas Tech is somewhat close to a lock because I can’t figure out where else you’d send them.

How does the mess you typed out affect Tennessee?

…seems like you should be looking at Pittsburgh hotels or AirBNBs? Maybe? I’d give the percentages as such:

  1. Pittsburgh (55%)
  2. Indianapolis (20%)
  3. Greenville (20%)
  4. Randomizer (5%)

Complain about the odds if you want, but Indianapolis simply seems more realistic because I can envision Tennessee moving ahead of Purdue more than I can them moving ahead of Duke. I do not agree with that being the case – frankly Purdue’s resume is significantly better than Duke’s – but it appears to be the case. Worth noting that ~77% of the odds here correspond to a Friday/Sunday site.

Can you repost the thing about how Tennessee only plays day games in March?

Sure. From last time, here’s Tennessee’s tip times since the field expanded to 68:

  • 4:30 PM ET (2021)
  • 3 PM ET (2019)
  • 12:40 PM ET (2018)
  • 2:45 PM ET (2014)
  • 12:40 PM ET (2011)

That’s five consecutive daytime tips in a row. A fair(ish) Selection Committee and TV crew would give Tennessee an evening slot, but they could’ve done that after three or four in a row, too. My recommendation is to not be surprised by anything that happens.

Anything else?

If there’s more I’ll just Tweet it out, because 4,200+ words is enough. I think there’s a compelling case to be made for Tennessee as having a better resume than the counterparts they share the 3 seed line with, but if I’m going to make it I would prefer for it to not sound fanboy-ish. Thanks for reading; more to come.

Tennessee’s remaining SEC Tournament scenarios, from a 1 seed to a 4

Well, the fun part of being out of office for a week is that you end up in a manic writing mode the very first day you come back. This is a good thing, I think. Tennessee’s regular season is just two games away from ending, and things have set up quite well for them. How well? I can help you explore that.

There are three Tennessee-specific scenarios singled out here. I’m not including the one where Tennessee drops a stunner to Georgia because…well, let’s just not go there. (It would almost certainly result in a 4 seed, so just keep that in mind.) These are what I’d consider to be three pretty obvious ones, all of which directly play a role in Tennessee’s seeding outcomes. You can flip games around if you choose (use the tool I used!), but if Tennessee wins out, only one other game actually matters this week for determining where they’d finish.

  1. Go 2-0, all the KenPom favorites win.

Result: 2 seed (tipoff 6 PM ET, Friday)
Projected Opponent: winner of (10) Mississippi State/(7) LSU

Here is the most likely scenario, but in the sense that in a pack of nearly 200 possible outcomes, the most likely 14-game pack of events has a 1% chance of happening. ANYWAY, this is assuming a moderately obvious string of events: Auburn goes 2-0 and wins the conference, Kentucky goes 2-0 and finishes third, Arkansas goes 1-1, no sort of upset happens. This is what that bracket would look like.

You’re looking at a potential road that sees Tennessee having to defeat KenPom #17, #2, and #10 for a conference title. Not ideal. These would be the odds, using Bart Torvik’s Tournament Simulator tool but with KenPom’s February 27 numbers:

Considering Tennessee’s base title odds right now are 19.4%, I guess that’s technically an improvement, but it’s certainly not your happiest path to Sunday. Either way: 14-4 gives you the SEC 2 seed and a real win-and-2-seed opportunity with Kentucky that Saturday.

2. Go 2-0, Auburn loses to Mississippi State on Wednesday, all other KenPom favorites win.

Result: 1 seed (!!!) (tipoff 12 PM ET, Friday)
Projected Opponent: winner of (9) Texas A&M/(8) Mississippi State

Oh yeah. This is what I was referencing: as long as Tennessee goes 2-0 this week, only one game actually matters for them that they aren’t involved in. Auburn plays twice this week, but the second of those is Senior Day at home against South Carolina (92% win likelihood), so no need. What we really care about here is that Wednesday tip with Mississippi State. If Auburn loses this game, which they have a 35% chance of doing, Tennessee will be the 1 seed by defeating Arkansas. The last time Tennessee was the SEC Tournament 1 seed, I was 14. I am 28 now.

This, frankly, would be a gigantic swing for Tennessee. Auburn would fall to second and Kentucky third, meaning Tennessee would play neither team until championship Sunday. This is what such a bracket would look like:

And these would be the odds:

As a spoiler, Kentucky is going to be the SEC Tournament favorite, barring some sort of insane draw. (As in them getting LSU > Auburn > Tennessee or similar.) There are two main points here: Tennessee’s title odds would jump 8%, and they’d have a >50% chance to be playing in the championship game on Sunday. That exact scenario – beat Mississippi State, beat Arkansas – would currently place Tennessee as the final 2 seed in the field heading into Sunday, per Torvik’s TeamCast tool. What more could you ask for?

3. Go 1-1, all other KenPom favorites win.

Result: 4 seed (tipoff ~2:30 PM ET, Friday)
Projected Opponent: winner of (5) Alabama vs. (12) Missouri or (13) Ole Miss

Ugh. Arkansas beats Tennessee, everything else holds. Don’t feel like discussing this extremely annoying scenario much, so hopefully it doesn’t happen. Anyway, here’s that bracket:

And here’s the odds.


Here’s a big grab-bag of various possible outcomes that don’t necessarily involve Tennessee, but we’ll toss Tennessee in at the end of each for context:

  • The higher-ranked KenPom team wins each game. This does not mean the favorite wins each; for example, Florida is rated higher than Vanderbilt, but Vanderbilt being at home gives them the projected edge. Flipping that result as well as two others (State > A&M, Vandy > Ole Miss) would create a sixth-place four-way tie at 9-9. In this scenario, 2 seed Tennessee would play the winner of (7) Florida/(10) Vanderbilt.
  • Every home team wins…except Georgia. Plausible! The SEC home win rate this year is 64.3%, the highest of any college basketball conference. If home teams go 13-1 (including a Tennessee 2-0 run), Tennessee would be the 1 seed and would play the winner of (8) South Carolina/(9) Mississippi State. Wildest of all: the 4 seed would be Kentucky.
  • The scenario where all KenPom favorites win. AKA, the most likely scenario, but not necessarily the one that will happen. This is what such a bracket would look like:
    • (1) Auburn vs. (8) Texas A&M/(9) Florida
    • (2) Tennessee vs. (7) LSU/(10) Mississippi State
    • (3) Kentucky vs. (6) South Carolina/(11) Vanderbilt/(14) Georgia
    • (4) Arkansas vs. (5) Alabama/(12) Missouri/(13) Mississippi
  • The projected KenPom standings themselves. Which have Auburn at 15-3, UK/UT at 14-4, Arkansas 13-5, and a mess behind it.
  • This exact standings order cannot exist, because of some of the remaining matchups. However, a force-fit of an arrangement like this produces:
    • (1) Auburn vs. (8) South Carolina/(9) Mississippi State
    • (2) Tennessee vs. (7) Florida/(10) Vanderbilt
    • (3) Kentucky vs. (6) LSU/(11) Texas A&M/(14) Georgia
    • (4) Arkansas vs. (5) Alabama/(12) Missouri/(13) Ole Miss
  • The Schadenfreude Scenario. The one where your mortal enemies go to die. Bask in the glory of this one: Florida goes 0-2. Will Wade goes 0-2. Auburn drops a game. Vandy goes 2-0 and extends Stackhouse. Alabama loses at home to Texas A&M. Kentucky…well, bear with me. But think about that: a ruthlessly funny batch of results that simply makes you bask in hatred. This results in three extremely wonderful things: a three-way tie for the 1 seed that Tennessee wins, Tennessee avoids Auburn AND Kentucky until the final, and it produces a four-way tie at 8-10 that would give Florida the 11 seed and LSU the 9. That’s right: Florida and Mike White, depending on other results, can still potentially play on Wednesday. Here’s what that bracket looks like:
    • (1) Tennessee vs. (8) Vanderbilt/(9) LSU
    • (2) Auburn vs. (7) South Carolina/(10) Texas A&M
    • (3) Kentucky vs. (6) Mississippi State/(11) Florida/(14) Georgia
    • (4) Arkansas vs. (5) Alabama/(12) Missouri/(13) Mississippi
  • The Maximize Your Resume Scenario. This one was a request and a fairly simple one: what’s the three-game path that gives Tennessee the highest possible amount of Quadrant 1 wins? As a reminder, anyone in the NET Top 50 on a neutral floor is a Quadrant 1 opponent. As of time of publishing, only six SEC teams rank in the top 50, but two teams – Florida and Mississippi State – are 51st and 52nd. It’s reasonable to say that either could slide into the top 50 based on other results. So: you’d prefer Florida or MSU as your quarterfinals opponent and no major upsets elsewhere. Something like this would be acceptable. In fact, the scenario above where every KenPom favorite wins leads to exactly this, and if State beats LSU, they could very well be in the top 50.
  • The 3 Seed Scenario. Say you’re a guy…perhaps one named Will Warren…and two months ago, you signed up for a half-marathon on March 12. This is a virtual half, but for two months, you’ve planned to run this at sunrise, which is 6:03 AM Central that day. And say that the SEC Tournament has its 3 seed play at 7:30 PM Central, which doesn’t seem that late but is not ideal for a cramped schedule. Say that, like every other conference tournament basketball game, it starts 15 minutes later than expected and ends at 10. Technically, Tennessee can still be the 3 seed, but it requires a string of independent events to go precisely this way:
    • Arkansas beats LSU (60% chance)
    • Arkansas beats Tennessee (27% chance)
    • Kentucky beats Ole Miss (94% chance)
    • Kentucky loses to Florida (29% chance)
    • Tennessee beats Georgia (93% chance)
  • I guess it’s troubling that only two upsets is required to get there, but that’s still two upsets, neither of which are that likely. I would place the order of seeding likelihood at 2 > 1 >> 4 >>>> 3.
  • Chaos Mode Scenario, Tennessee Edition. Everyone implodes. Tennessee loses to Arkansas. Kentucky loses twice, somehow. So does Auburn. Arkansas loses to LSU. Will this happen? Of course not. But in the very rare event of a four-way tie at 13-5, it resolves like this:
    • 1. Arkansas (4-0 against other three)
    • 2. Tennessee (2-3)
    • 3. Auburn (1-2)
    • 4. Kentucky (1-3)
  • Chaos Mode Scenario, Mid-Pack Edition. Basically: how many teams can possibly tie for any given spot? As of now, six teams can tie at 9-9, which would involve everything from the 5 seed to the 10. This specific scenario predictably requires an unusual string of results, which is as follows.
    • Florida goes 1-1, losing to Vanderbilt but beating Kentucky.
    • Alabama goes 0-2.
    • LSU goes 1-1, losing to Arkansas but beating Alabama.
    • Mississippi State goes 1-1, beating Auburn and losing to Texas A&M.
    • South Carolina goes 1-1.
    • Texas A&M goes 1-1.
  • This combines to create the following hilarious standings order, which I am now rooting for. It would also obviously result in 1 seed Tennessee due to the Auburn loss.
    • 5. LSU (5-2 against this six-team pack)
    • 6. Alabama (4-3)
    • 7. South Carolina (3-3, but 1-0 against A&M)
    • 8. Texas A&M (3-3, but 0-1 against Carolina)
    • 9. Florida (2-3)
    • 10. Mississippi State (2-3)

If you have other questions or scenarios you want explored, email statsbywill@gmail.com and I’ll get back to you.

2021-22 Bracketology, Vol. 1: where Tennessee stands, how they could rise/fall, and best/worst NCAA Tournament draws

Normally, I don’t do any NCAA Tournament or bracket-related posts until the Monday after the Super Bowl. Most readers generally can’t get into it until that date, and neither can I. However, 2022 presents a new challenge: the NFL has turned their season into 18 weeks, and therefore, the Super Bowl is now the second Sunday of February, not the first. This is fine, because I respect and worship The Shield™, but it’s not great for content planning or breaking a long-standing routine.

So: a compromise. This is a post that serves as an introduction to Tennessee’s 2022 bracket concerns. There will be two more posts – one February 22, one March 8 – that go into further detail, answer certain questions, and explore some ideas of what works and what doesn’t in March. For now, think of this as a post that answers three concerns:

  1. Where does Tennessee stand right now from a seeding perspective?
  2. With eight games left, how will various finishes and final records leave Tennessee looking, both in SEC standings and in Tournament seeding?
  3. What are Tennessee’s best and worst possible draws?

This is a post that comes just shy of 3,000 words, so we’ll dive right in.

1. Where does Tennessee stand as of February 8?

Pretty well! Thanks for asking.

…anyway, Tennessee sets up pretty nicely for a run to the finish. Bracket Matrix, the bracket consensus site, has not updated since February 4 at the time this piece was typed. As of last Friday, they had Tennessee as the highest 5 seed, which is confusing because they have the same number of good wins and two fewer bad losses than 4 seed Michigan State, but if it’s surprising that Michigan State gets more love than Tennessee I have a beach house in Idaho for you.

More reliable, at least for the purposes of what we’re discussing, is Bart Torvik’s TourneyCast tool. It’s the only tool out there I trust that accurately represents the instability being a month-plus away from the NCAA Tournament possesses. When you’re in Tennessee’s position – good enough to be widely considered no worse than a top-20 team, not good enough to be considered a top-10 one – you have quite the amount of uncertainty. Factor in Tennessee’s 3-6 record against Quadrant 1 teams and you can see where a bracketologist might be a little lower on Tennessee than a metrics guy.

Still, things look pretty good. Here’s what the TourneyCast has to say about Tennessee’s seeding odds the remainder of the way. I only used those with at least a 5% chance of happening, because otherwise, I will get a reply to this article asking me about the possibility of being an 8 seed.

  • 1 seed: 5.2% chance
  • 2 seed: 17.6%
  • 3 seed: 21%
  • 4 seed: 21.3%
  • 5 seed: 19.6%
  • 6 seed: 11.2%

Tennessee’s average seed on TourneyCast is a 3.8, which would translate to them being roughly the 14th-ranked team in the field on Bracket Matrix. Again, seems like a fair guess for a team ranked 13th on KenPom and 18th in Wins Above Bubble.

Prefer something you think sounds more reliable? Say, a little tool from the Worldwide Leader? Well, wouldn’t you know it, ESPN now has a seed projection tool that has Tennessee at…

…oh dear. Well, forget you saw that. As a reminder, BPI believed Tennessee was the best team in the SEC last year entering the SEC Tournament, which was mighty hard to defend if you look at any metrics site in existence. I can’t figure out how they weigh certain games; if I find out I’ll let you know.

Here’s two more that I feel less confident in, but exist and are worth taking a look at. First, TeamRankings.com has a bracketology tool that places Tennessee as the 16th-ranked team in the field. They don’t provide an average seed, but their graph is less friendly to Tennessee, giving them no real shot at a 1 seed (fine) and a >5% shot at an 8 seed (wait a minute).

Lastly, there’s this mysterious website called INCC Stats. Its first function appears to be as some sort of cross-country running site for Indiana high school athletes, but its secondary function is that of a college basketball ratings site that offers a remarkably strong resemblance to a blend of Sports-Reference and KenPom. Tennessee ranks 14th in their field as well, with an average seed of 4.3. (If Tennessee beats Mississippi State, they’re expected to improve to 3.9.) This is a little harder to read because this goes along with a chart of various SEC records, but just follow the basic outline at the bottom.

So, what have we learned? What can you learn?

  • Tennessee, on the majority of sites with an NCAA Tournament forecasting tool, has roughly a 60% chance of finishing somewhere on the 3-5 seed lines. That doesn’t mean Tennessee will do this; it just means that as of February 8, it’s what they’re most likely gonna do.
  • Tennessee’s most likely outcome is a 4 seed. Again, this isn’t a guarantee; it’s just what’s most likely. On the three sites that list their odds in full, Tennessee has between a 21-27% shot of being a 4 seed.
  • There are scenarios, some more realistic than others, where Tennessee could end up a 7 seed, 6 seed, 2 seed, or even a 1. I don’t think any of them sound super realistic, but ESPN sure seems like a believer.
  • To ensure Tennessee’s status as a 4 seed or better, they’ve gotta win some big games. Which leads us to the next question.

2. What records get you what seeds heading into the SEC Tournament?

With the help of both Torvik and INCC Stats, I’m just going with remaining records that at least have a puncher’s chance of happening. Even KenPom, which is a little rosier than Torvik on Tennessee, only gives the Volunteers a 4.8% chance at going 8-0 to finish the season. Could that happen? Sure. Will it? Probably not. Likewise, Tennessee going 0-8, 1-7, or even 2-6 is extremely unlikely – none of those scenarios have more than a 2% chance of coming to fruition. So we’ll focus in on five specific runs to the finish, all of which have at least a 7% chance of happening: 3-5, 4-4, 5-3, 6-2, and 7-1.

The average seeds by record are via INCC Stats; considering Torvik is a little more positive on their seeding outcomes, you can bump up the seed listed by 0.1-0.2 if you want his numbers instead.

19-11, 10-8 SEC (3-5 finish)

  • Losses to no fewer than one Quadrant 2/3/4 opponent
  • Assuming 0-1 wins over Quadrant 1
  • Expected SEC finish: 4th or 5th
  • Average seed: 6.9
  • Chances of happening: 6.9% INCC, 6.4% Torvik, 4.4% KenPom

This would be a disastrous run to the finish, of course. Tennessee currently sits in a position where they’re >75% likely to finish in the top 3 in the SEC and >90% likely to finish top 4; this is the only realistic outcome that would put a top-four finish in very real doubt, and if you’re going 3-5 to the finish against this schedule, anything is possible in the SEC Tournament in a bad way.

Tennessee would have done enough to likely be a 7 seed, but if Tennessee gets here, it means they’ve lost all four of their coin-flip games (Mississippi State, Kentucky, Arkansas, Auburn) and suffered a real upset at the hands of, say, Missouri. It’s the type of finish that makes you an obvious fade bet in the first weekend. Let’s pretend we didn’t see this.

20-10, 11-7 SEC (4-4 finish)

  • Assuming 0-4 or 1-3 Quadrant 1 record
  • Expected SEC finish: likely 4th, but a decent shot at 3rd
  • Average seed: 5.5
  • Chances of happening: 16.8% INCC, 18.3% Torvik, 13.1% KenPom

It says a lot about the quality of the SEC beyond the top three that even a 4-4, 11-7 SEC finish would still probably keep Tennessee at an SEC Tournament double-bye and maybe even the third overall seed. Still, this would be disappointing, even with Olivier Nkamhoua’s injury.

As of now, the 5.5 average seed would actually make Tennessee the highest-rated 6 seed, but the 6 seed line must be avoided at all costs. Since the field was expanded to 68 in 2011, 6 seeds are 19-21 in the first round and have just a 15% success rate in making the Sweet Sixteen

21-9, 12-6 SEC (5-3 finish)

  • Assuming no worse than one additional Quadrant 1 win, or two Quadrant 1 wins but one Quadrant 2-4 loss
  • Expected SEC finish: 3rd
  • Average seed: 4.6
  • Chances of happening: 20.5% INCC, 29.6% Torvik, 25.5% KenPom

This is where I make a special note than KenPom’s numbers give Tennessee a better shot at finishing 13-5 than 12-6, but the difference on both Torvik and KenPom is small. You’re looking at a coin-flip to either finish with 12 or 13 SEC wins, essentially. Given the Nkamhoua news, maybe that coin flip goes against you now. Who knows?

Anyway, this means you have defeated at least one and possibly two of State/Kentucky/Arkansas away/Auburn while either losing the rest of losing to one of Missouri/Arkansas home. It’s a decent outcome, but you’d essentially go into the SEC Tournament needing a win over likely 2-seed Kentucky to move from the 5 line to the 4. Once again, this is important; 5 seeds are 24-16 in the first round since the field expanded, while 4 seeds are 31-9 and have made the Sweet Sixteen twice as often (23 to 11).

22-8, 13-5 SEC (6-2 finish)

  • Assuming a 2-2 record against Quadrant 1 opponents or a 3-1 record with one Q2-Q4 loss
  • Expected SEC finish: likely 3rd, outside shot at 2nd
  • Average seed: 3.8
  • Chances of happening: 27.1% INCC, 27.7% Torvik, 29.9% KenPom

If you combine the odds of these two sites + KenPom, this is Tennessee’s most likely outcome. What an outcome it would be: multiple wins over the State/Kentucky/Arkansas away/Auburn grouping, which would push you to five Quadrant 1 wins. As long as you draw any of Arkansas/Florida/Mississippi State in the SEC Tournament quarterfinals, you have an opportunity to add a sixth. That’s important.

In this scenario, assuming an SEC Tournament semifinal loss, Tennessee would close the season with an 11-9 record against Quadrant 1 + 2 opponents combined. Only 23 teams in 2018-19 played at least 20 games against Q1+2 competition and finished with a winning record. That, combined with Tennessee’s flawless record against Quadrant 3 & 4 opponents, would likely lock up no worse than a 4 seed.

There is one moderately realistic outcome that’s better, though.

23-7, 14-4 SEC (7-1 finish)

  • No worse than a 3-1 record against Quadrant 1 opponents
  • No losses to Q2-Q4 teams
  • Expected SEC finish: no worse than 3rd, with a tiebreaker with Kentucky determining 2nd
  • Average seed: 2.9
  • Chances of happening: 16.6% INCC, 13.7% Torvik, 20.4% (!) KenPom

Well, it’s not out of the question, but it’s less likely than 13-5, 12-6, and 11-7. Still, it’s worth exploring. Here’s the path I would deem most likely:

  1. Tennessee holds serve in three should-be-easy games: home Vanderbilt (88% to win, per KenPom), road Missouri (83%), road Georgia (91%). The odds of these three events happening are 66.5%.
  2. Tennessee beats Arkansas (78%) on Senior Day. Arkansas is good and getting better, but it’s a home game at a place Arkansas rarely wins. This plus the three gimmes: 51.9%. Still looking good.
  3. Tennessee beats Mississippi State (60%) tomorrow. 31.1%, which I swear to you is pretty good for a series of five independent events.
  4. Tennessee wins two of three against the following: Arkansas on the road (57%), #1 Auburn (55%), or #5 Kentucky (49%). If you treat these three as independent events, which they are, Tennessee has a 90% shot at getting one win. Against this trio specifically, Tennessee’s most likely outcome is 2-1. That’s if they proceed through the 31% likelihood of going against the other five teams unscathed.

You can see why this is unlikely, even though Tennessee is technically favored in seven of their final eight. (Because I am sure I’ll be asked, their average seed if they win out is 2.0, but again, that’s a 6% event. Can happen, very likely won’t.) Still: the path is there, and you don’t have to squint much at all to see it. If Tennessee can get a few lucky bounces here or there, 7-1 is 7-1.

3. As of today, what are Tennessee’s best and worst NCAA Tournament draws?

All seedings are based on two things:

  1. Where they are on the Bracket Matrix consensus as of right now;
  2. For seeds 12-16, if they have a >15% chance of making the NCAA Tournament, per Bart Torvik’s TourneyCast. Upsets happen in conference tournaments, and this is our way of getting them in a projected field. (I needed a cutoff point and 15% sounded like an accurate midpoint between 10-20%.)

Also, for the purposes of our…”study,” I guess, we’re assuming that Tennessee makes the NCAA Tournament as a 4 seed. It’s their most likely outcome on pretty much every site I read, and we can adjust that projection in a couple of weeks if needed. All numbers in the projections are via KenPom.

The GOAT Draw

  1. Auburn (SEC)
  2. Duke (ACC)
  3. Wisconsin (B1G)
  4. Tennessee (SEC)
  5. Ohio State (B1G)
  6. Texas (B12)
  7. Saint Mary’s (WCC)
  8. Boise State (MWC)
  9. Loyola Chicago (MVC)
  10. Seton Hall (BE)
  11. North Carolina (ACC)
  12. North Texas (CUSA)
  13. Hofstra (CAA)
  14. Liberty (A-Sun)
  15. Colgate (Patriot)
  16. Penn (Ivy)

“But Will,” you holler, “you put the #1 team in Tennessee’s bracket. Surely, this must be a mistake.” Shirley, I can be serious. Of the current #1 seeds – Auburn, Gonzaga, Purdue, and Kansas – it is Auburn who ranks lowest in a metrics average of the four, settling in around the eighth-best team in America. If you want to replace Auburn with Kansas, who is a spot or two ahead of them in some places, go for it. But I’m standing by this.

Auburn has very much earned their status as #1 in the AP Poll through a variety of great wins and timely cash-ins of luck. But the very best teams in college basketball rarely have to escape the bottom two teams in their conference by a combined three points. Sure, Auburn won both games…but did it actually make you feel better about their odds of somehow going undefeated in SEC play? I’m banking on two things here: a moderate reversal of fortune (i.e., Auburn loses 2-3 SEC games, loses in the SEC Tournament) and a genuine belief that even a really, really good team is capable of a bad night at the wrong time in March. This is the same team that’s nearly lost to South Florida, Saint Louis, Missouri, and Georgia. They’re not perfect.

This draw is complicated because, on one hand, it would be perfect if Tennessee drew literally the worst possible 1-16 seeds at every line. However, I have an alternate plan: what if Tennessee’s potential Round of 64, Round of 32, and Sweet Sixteen higher seeds are all below-average, but their bottom-bracket adversaries (seeds 6, 7, 10, 11) are all really good? If Tennessee made the Elite Eight and all they had to do was beat a 6, 7, 10, or 11 seed, you would take that gamble every single time, even if it didn’t work out. Therefore, you want really, really good lower seeds on the bottom half to knock out the 2 and 3 seeds.

Along with that, we’re making the 14, 15, and 16 seeds super-powered, or at least as much as I realistically can. (I debated doing the same with the 8/9 seeds, but it’s probably in Tennessee’s advantage to just draw an average 8 or 9 seed, not 2020-21 Loyola Chicago or something.) (Also, I would prefer a 12 seed that is good enough to be threatening but not scary enough to knock Tennessee out themselves. Learned my lesson last year.) The goal is this: Tennessee makes the Elite Eight while facing a 13, a 12, and a 9 seed. Worst case scenario: you draw the worst 13, worst 5, and worst 1 seed in the field.

What this produces is the following:

  • Baseline Tennessee NCAA Tournament odds, per Torvik: 80.7% to make Round of 32; 47.8% to make Sweet 16; 22.9% to make Elite Eight; 10.6% to make Final Four
  • GOAT Draw: 90.4% Round of 32; 64.7% Sweet 16; 33.6% Elite Eight; 18.2% Final Four

This draw almost doubles Tennessee’s odds of the first-ever Final Four run in school history. Not only is that nice, but check out the rest of this bracket. The 3 seed is only 27% likely to make the Sweet Sixteen. The 2 seed has just a 44% shot to see the Elite Eight. Your second and third most-likely draws from the bottom half of the bracket are the 6 and 7 seeds. If I, today, told you Tennessee could have a one-in-three chance to make the Elite Eight…you’d take that, right? That’s why this is the GOAT Draw.

The Poop Draw

  1. Gonzaga (WCC)
  2. Arizona (Pac-12)
  3. Houston (American)
  4. Tennessee (SEC)
  5. Texas (Big 12)
  6. Iowa State (Big 12)
  7. Indiana (B1G)
  8. Boise State (MWC)
  9. Davidson (Atlantic 10)
  10. Miami (FL) (ACC)
  11. Wake Forest (ACC)
  12. UAB (Conference USA)
  13. Furman (Southern)
  14. Navy (Patriot)
  15. Cleveland State (Horizon)
  16. Nicholls State (Southland)

A truly funny and terrible thing is that this draw actually gives you a better shot to exit the first round and an equal shot to make the Sweet Sixteen as the baseline. This is because the baseline has a lot of uncertainty involved and considers pretty much anything from a 2 to 6 seed for Tennessee to at least be mildly possible.

For this, we’re giving Tennessee a true murderer’s row to get through. If you can escape Furman – the highest rated potential 13 seed in KenPom at #67 – you’re either rewarded with a Texas team you just lost to a week ago or a UAB team that’s 38th in KenPom. Escape that grueling weekend? Congrats. Your reward, in 87% of simulations, is #1 Gonzaga. If you somehow pull off the upset of a lifetime, your next reward is either #2 Arizona or #4 Houston.

My hope with this draw is to illustrate what a true Selection Hell looks like: Tennessee gets the worst possible 1-3 and 5 seeds, gets zero help from the 6-11 seeds, then proceeds to draw the toughest 12 and 13. It’s an absolute nightmare…and yet: that absolute nightmare still results in a Sweet Sixteen almost half the time. I guess it could be worse!


A summary of what has been learned so far:

  • Tennessee will most likely be a 3, 4, or 5 seed.
  • Their most likely final SEC record (per KenPom) is 13-5, closely followed by 12-6, 14-4, then 11-7.
  • Hope you don’t draw Furman or UAB.
  • Hope your enemy seed draws Furman or UAB.
  • Hope you get a bad 1 seed or your 1 seed draws Dream Killer Loyola Chicago.

More to come soon.

You Merely Adopted the Mud, We Were Born In It

January 18: #24 Tennessee 68, Vanderbilt 60 (12-5, 3-3 SEC)
January 22: #24 Tennessee 64, #13 LSU 50 (13-5, 4-3 SEC)

Sometime during Tennessee’s wire-to-wire beating of top-15 LSU on Saturday – maybe when it was 42-28 and Tennessee had held LSU to three points across the last 10 minutes of play – I had a realization. For all of the complaining, all the whining about how this offense isn’t terribly good and the product on the court is genuinely unwatchable at times, we are discussing a team that ranks in the top 15 nationally in the advanced metric of your choosing. They are very, very good at several things. The thing they are very best at is taking about 90% of their opponents, turning the heat up on defense, watching as the dirt turns to wet, wet mud, and seeing these overmatched opponents flop around, unable to find stable footing in the Knoxville slop.

This is the genesis of good things for Tennessee. Sure, you get the occasional great shooting nights…sure, Tennessee still has the capacity to do a lot of good inside the perimeter…sure, there are other ways to win. But this – dragging other teams into the mud like little pigs, watching them flounder as you laugh at how uncomfortable they are – this is Tennessee’s identity. And at some point, you have to be alright with that.

I’m there. I’m good with it. If Tennessee has to win games 64-50 and 66-46 and 69-54 and 66-60, good. They’re wins. Three of those are butt-kickings. Tennessee is wholly uncharmed by style points. They simply don’t care if you think it’s pretty or watchable or goody-goody two-shoes happy happy joy stuff. They are winning games by stuffing the opponent in a locker for 40 minutes. Only two teams have managed to escape an opponent-adjusted locker-stuffing this season; they are ranked #6 (Villanova) and #7 (Kentucky) on KenPom as I type.

The most fun Tennessee team of all-time is still 2018-19 Tennessee, the only team of the Rick Barnes era to have a truly good offense. I don’t mind speaking that as a truth, because it is a truth. I like watching great offense a lot more than I do great defense, because I like watching the orange ball go in the net and the crowd going bonkers. It is a good thing and it is supposedly why anyone watches this sport in the first place. Then again, attempting to figure out what Tennessee fans want on a weekly basis has proven difficult.

The point of this is that Tennessee basketball has an identity. Tennessee basketball is Mountain Wisconsin. Bo Ryan, outside of about two years where he had a top 10 pick on his roster, was entirely unconcerned with making you happy with lovely offensive play. He did not care about how much you liked watching the ball go in the net. He only cared about winning by any means necessary. (Reportedly, he also cared pretty deeply about quitting midseason because ALLEGEDLY an affair was going on. I do not believe that will ever be a concern with Rick Barnes.)

Bo Ryan-era Wisconsin would drag you into the mud and watch you flail around helplessly as the Badgers cruised to wins of 57-50 and 52-45 and 68-56, all over top 15 opponents. You were not born in the slop. You were not raised in the slop. This Tennessee team seems wholly comfortable pulsing your team in the blender for an uncomfortable amount of time.

Nothing about this is terribly pretty. I also am not sure that ‘pretty’ really matters right now when the team is 13th on both KenPom and Torvik and cruising right along towards being a 3 or 4 seed in the NCAA Tournament. It is exactly what most of us expected preseason. The route to get there has been choppy, but with Tennessee’s most difficult month out of the way, maybe February is where you get the style points and the capital-F Fun back. Look at this:

And tell me you can’t feel at least a little bit of excitement for the local basketball program. Even taking those games in the 50s as coin-flips, you can pretty easily stare at that and see an 8-2 run in SEC play to the finish with at least two added Quadrant 1 wins. That would be 13-5 in the SEC, or merely tying the second-best SEC effort Tennessee basketball has seen in 14 years. That’s pretty good. The team is pretty good. It’s worth acknowledging, even if they don’t play a style most actively desire.


The other thing that has happened is that Tennessee has sort of kiboshed the idea of Smokey as the team’s mascot. This role is now Uros Plavsic’s to lose.

In the span of three weeks, Plavsic has turned from a guy most fans saw as completely unplayable to arguably the team’s best post player. I’m typing that out now and it still feels unbelievable. I promise you it’s real. These are the conference-only numbers via Bart Torvik’s site:

The last thing we saw prior to SEC play was John Fulkerson dropping 24 points on an Arizona team that looks like, at worst, one of the four or five best college basketball has to offer this year. The last time Uros Plavsic had scored double-digit points was February 1, 2020. His career-high for rebounds in a game: four. This is for a 7-footer who entered college as a low four-star recruit that convinced both Arizona State and Tennessee to take a chance on him.

Plavsic drawing a billion fouls against Alabama is one thing. Plavsic putting up 13 & 7 on the road at Vanderbilt is another thing. But hitting this, the longest shot attempt of his season:

And doing this two minutes later:

Is something entirely new. (I don’t care that the block probably should’ve been goaltending. It looked cool and that counts.)

Uros Plavsic will probably never be a dominant basketball player. The agility may never be there. I obviously would prefer to never see him attempt a jumper because I’m sure that would look as weird as it does in my head. Also, all of the previous three sentences are entirely meaningless. Right now, Uros Plavsic is doing everything he can to make Tennessee the best basketball team it can be. He’s earned his right to start and finish games ahead of John Fulkerson and Brandon Huntley-Hatfield. Right now, the team is about 1.5 points better per 100 possessions when he’s on the court versus when he’s off.

For this man at this time, I couldn’t be happier. I think of all the tweets and online comments he’s seen about how he’s an embarrassment to basketball. How he shouldn’t be a scholarship player at an SEC university. How he somehow tricked 1.5 coaches (sorry, Bobby Hurley isn’t a real coach) into giving him a scholarship. How Rick Barnes was dumb for continuing to give him a chance. You read a quote like this:

And you read this, from Plavsic’s own writing about his basketball career before last season began:

And you remember entirely what it is that makes you care about college sports in the first place. Uros Plavsic doesn’t have to do any of this. It is entirely of his own volition. Never once has Plavsic complained to the media about not playing, about being a team cheerleader, about being a guy who didn’t really contribute much to the team during his first 2.5 seasons in orange. Every single game, whether the guy is on or off the floor, you see the energy Plavsic has that he tries to transfer to everyone else. After every dunk last season, the first person you’d see cheering from the bench was Plavsic. After every block, Plavsic was yelling at the opponent and letting them know precisely what he thought of them.

At this moment, for this time, Plavsic is the Master of Ceremonies. If you want to further the analogy of the first section of this post, Uros Plavsic is the Master of Mud. He has learned how to drag opponents, whether in the Twitter sense of dragging someone or simply lulling them to sleep with his array of hooks and quietly-improving defense. At perhaps the least-likely time of his entire career, he has emerged as a genuinely important and lovable piece of the puzzle at Tennessee.

Rooting for Uros Plavsic to succeed is almost as easy as breathing air. I look forward to continuing to do it, no matter how the rest of his season plays out. He’s earned his moment in the sun; I sincerely hope that, for him, it lasts a very long time. In a season laden with various frustrations, he and Zakai Zeigler have been tethers to fandom in a way I haven’t experienced in a while. It’s nice to see them repaid for their work.


Some various notes of the last week:

  • Tennessee posted a 38.4% eFG% against Vanderbilt and won. Unfortunately, that happened, but it feeds into our pig-slop narrative so hang on with me. Tennessee’s now won five games in the last three seasons where they posted a 40% or worse eFG%; only Texas A&M, among SEC teams, is able to say the same. Obligatory!
  • Tennessee’s now held 15 of 18 opponents below 1 PPP. So, without context, you probably don’t care much about this stat, but I promise it’s pretty important. KenPom rates Tennessee’s schedule so far as the 8th-toughest in America, with nine games in the Tier A (his equivalent of Quadrant 1) grouping. Only three teams – Villanova, LSU, Kentucky – have topped 1 PPP. Consider that last year’s awesome defense allowed nine teams to go >1 PPP, the 2017-18 killers gave up 15 >1 PPP games, and as far as I could find, no Tennessee team in a non-COVID season has allowed fewer than 12 of these games (2009-10). This is on track to be a historically good defense, and they’re a week away from finishing the meat of their schedule. The final ten games feature six against Quadrant 2 or lower competition, or one more than all of December/January combined.
  • Even the LSU slop was actually pretty successful on offense. Tennessee managed 64 points on 65 possessions (0.985 PPP), which looks bad on its face…but is also the highest PPP surrendered by LSU this season by a good margin. Torvik translates this to about a 1.23 PPP performance against an average defense, which is insane.
  • The Jimmy Dykes thing. He reached out Tuesday morning with a request and, thanks to some features I have via Synergy, I provided an answer Wednesday night. He is a good guy that I find myself constantly thankful for.
  • One bad thing: the Fulkerson/Plavsic lineup. Without fail, it seems like this gets anywhere from 3-10 minutes of run each game. It’s perhaps the one thing Barnes does that drives me the nuttiest, because it’s objectively a terrible combination. I would stop doing this immediately and just play one or the other, because it’s an offensive disaster.

Lastly: Game Scores. Bart Torvik has this awesome metric called Game Scores that are essentially telling you on a scale of 0-100 (average being 50) how good or bad your performance was. Basically, if you put up a 95, you’re playing like a team with a Pythag rating of .9500 (which would be top 5 right now). All of this to say that these are the current 95+ Game Score rankings:

Half of Tennessee’s performances have been really, really good. The other half have been somewhere between ‘still good’ and ‘oh God.’ Anyway, while I do think LSU’s are aided by some insane 3PT% luck, this feels like a mostly-fair representation of how good the very best of the SEC is. Auburn is a step ahead of everyone else; LSU gets there on their best nights; Tennessee is capable of crushing an opponent on any given night. The real surprise is seeing that Kentucky’s only uncorked a few truly dominant outings, one of which was obviously against Tennessee. Also, this should help you understand why Texas A&M isn’t even a top 60 KenPom team despite being 15-4: they have no results of any significance and are almost never dominating.

Thanks for reading. For more Tennessee basketball content and whatever else, head to @statsbywill on Twitter. If you would like to reach out privately: statsbywill at gmail.

College Basketball Watchability Above Replacement (CBBWAR): A new-old way to find the NCAA’s most entertaining teams

I think anyone who’s read my writing on Tennessee basketball can tell that over the course of the last month, the writing itself has grown more…negative? Cynical? Downward-looking? Over it? I’m not sure what the phrase is, but I’ve had a couple of people reach out with suggestions like “watch other teams.” I appreciate said suggestion, as I already do watch other teams, but that idea became rooted in my head as something I’d like to explore.

Long ago on Fangraphs, a baseball statistics site, writer Carson Cistulli created NERD, “an attempt to summarize in one number (on a scale of 0-10) the likely aesthetic appeal or watchability, for the learned fan, of a player or team or game.” I like baseball, but I realized about ten years ago that what I really love is postseason baseball. Regular season baseball…it’s 162 games, man. But instead of giving up on 162 games entirely, I loved reading Cistulli’s NERD reports every day, pinpointing the most interesting games of the week.

Cistulli left NERD (and Fangraphs) behind a few years ago, but the formula remains out there. I copied it to run my own sort of NERD for MLB this season, with a few tweaks (higher emphasis on homers, because homers) and new calculations. It selected the Los Angeles Dodgers, Toronto Blue Jays, and Tampa Bay Rays as the three most watchable baseball teams of 2021, which, yeah. (Braves fans: you were fifth. I imagine that if Weighted NERD existed, you would probably be top four or top three.)

Anyway, this is a long way of getting to the point: I’ve workshopped a similar idea for college basketball. Ensuring that all 359 team ratings are 100% accurate is borderline impossible, because 1) I have a day job and 2) As such, I’m unable to watch a lot of teams until they either play the team I cover or they’re on a network that everyone can agree on. I watch a lot of college hoops, but Sean Paul (not the singer) and others are whooping me in this regard.

To make up for this, I’ve devised a metric I’m loosely calling College BasketBall Watchability Above Replacement (CBBWAR). The name could be changed, but it’s a name that describes the point of the project and the acronym makes it sound like something that will get $41 billion dollars in military funding somehow. Here are the components involved, all sourced from either KenPom or Hoop-Math:

  • Tempo (alternately possessions per game)
  • KenPom Adjusted Offensive Efficiency (Adj. OE)
  • Effective Field Goal Percentage (eFG%)
  • Percentage of Shots That Are Long Twos (Mid%)
  • FG% at the Rim (Rim%)
  • Three-Point Efficiency (3PT%)
  • Defensive Block Rate (Block%)
  • Defensive Steal Rate (Steal%)
  • Three-Point Attempt Rate (3PA%)

Here’s how these components are currently weighted in my Excel sheet:

Tempo*0.5 + OE + eFG*1.5 – Mid*0.5 + Rim*0.5 + 3PT%*.75 + Block*0.5 + Steal*0.5 + 3PA*0.25 + Constant (currently 2.2, a completely arbitrary number to provide us with higher-rated teams)

What this roughly comes out to is an equation that values offense at 75%, defense about 18%, and tempo 7%. I like fast games, but I like seeing shots go in the net more. I do not like watching a bunch of mid-range twos by teams that generally cannot hit them. (Consider that the NBA average on a mid-range shot this season is 40.3%; in college basketball, it’s 36.9%, and only 21% of teams in America shoot at 40.3% or better. Thanks, but no thanks.) I like when teams hit threes. Also, I like when teams create havoc on defense by blocking a bunch of shots and forcing turnovers.

Unsurprisingly, eFG% and Adj. OE have the strongest correlation to a higher CBBWAR score at +0.94 and +0.86. Of the defensive stats, blocks (+0.30) have a higher correlation to watchability than steals (+0.10), which makes sense, because really good blocks are freaking cool. Tempo makes very little of a difference, which is ideal.

Your personal formula is probably different, which is fine. No two watchability metrics would ever be the same. But for me, this makes sense, and maybe it will for you, too. This metric is a work in progress, so don’t be surprised if/when it changes. For now, CBBWAR is what I’m using going forward to figure out which games and which teams are the ones I want to watch the most.

The initial CBBWAR rankings can be scrolled at the sheet below. A version where you can see the individual Z-scores is linked here:

As seen above, here’s the initial top 10 teams:

  1. Gonzaga (+14.19)
  2. Purdue (+12.5)
  3. Arizona (+11.48)
  4. Kansas (+10.56)
  5. South Dakota State (+10.15)
  6. Auburn (+10.08)
  7. Duke (+9.83)
  8. Iowa (+9.68)
  9. Davidson (+9.62)
  10. Colorado State (+9.46)

I genuinely like and would approve of this initial draft. To my eyes, I don’t see many teams missing from this top 10 (or top 20, to extend) that would be huge misses. Some of the selections will certainly appear strange, such as a 9-7 Memphis team being 18th overall or Santa Clara, the fifth-best WCC team, being in the top 12. What I would offer is this: no metric is perfect, and these two are early outliers. Still: as someone who isn’t a Memphis fan, this Memphis team is hilarious and amazing to watch. Santa Clara plays fast, scores efficiently, and is one of the best shooting teams in America. I kind of get it.

There are improvements to be made, certainly. I’ll expand on CBBWAR in coming weeks, with more changes after further testing and additional analysis with fair frequency. Hopefully, this gets us closer as a college basketball community to some sort of tool that combines team quality and subjective enjoyment. It will never be perfect or fully satisfactory, but I think it’s a decent start to expand upon.

Lastly, here’s a sheet that will be updated daily with the day’s most watchable games, per CBBWAR.

Revisiting Tennessee’s remaining schedule, from an NCAA Tournament resume perspective

Look: it is January 2 as I type this. I have not much to do at this point in time. I am watching my beloved, stupid Detroit Lions blissfully keep pace for the #1 overall pick. I am sitting through the longest break in Tennessee basketball’s schedule that they’ll have all season. So, naturally, this leads to me checking in on Twitter and seeing a truly terrific tweet from an online buddy:

Content! Content! Thank you for the content.

This is merely a quasi-symptom of what I’ve thought about doing for a few days: providing everyone an update of what Tennessee’s schedule is likely going to look like the rest of the season. I did this in the preseason for the season preview, but it’s been two months, so an update seems useful. Tennessee has 18 games left; 17 of those are SEC opponents, one of those is Texas in the Big 12/SEC Challenge. My guess is that people would like to know how Tennessee measures up here in all likelihood.

I’ve decided to measure this in a two-step method:

  1. First, I’m just using the projected Quadrant 1/2/etc. games as given by Bart Torvik’s website. Torvik actually does projected NET ratings using the available formula, which is really cool. We’ll also use his rankings, which are slightly different from Ken Pomeroy’s but use the same general idea.
  2. Also, I’m using hoop-explorer.com’s Build Your Own Top 25. I’ve weighted it as such: efficiency matters more than W-L, but only by a hair; there’s a mild bonus given to more dominant teams; there’s also a slight boost by weighting the last 30 days 10% more than the resume as a whole. These ratings, to my understanding, use KenPom as a source.

What this is going to do: provide you with two ratings. The first rating is their current rating on Bart Torvik’s website; the second is the BYOT25 rating. How useful is this? No clue, but it beats doing nothing.

The breakdown here is going to follow the NCAA Teamsheet format of Quadrants 1, 2, 3, and 4. Explanation(s) below. All numbers are NET rankings, which we obviously do not have but will be replaced with the Bart Torvik/KenPom/Haslametrics combined numbers for breakdown purposes.

  • Quadrant 1: Home 1-30; Neutral 1-50; Away 1-75.
  • Quadrant 2: Home 31-75; Neutral 51-100; Away 76-135.
  • Quadrant 3: Home 76-160; Neutral 101-200; Away 136-240.
  • Quadrant 4: Home 161-plus; Neutral 201-plus; Away 241-plus.

I’ll list out any differences between the two methods as they exist. Right now, Tennessee ranks #13 on Torvik, #12 on KenPom, and #16 in the BYOT25 thing because the non-conference schedule did…not exactly come together as planned. (Recall that Colorado and Memphis were preseason Quadrant 1 games.) Onward.

Quadrant 1

Previously, this also included Quadrant 1-A, but there’s no difference this time out, so…yeah.

Scheduled games:

  • January 8 at LSU (#12/#13)
  • January 15 at Kentucky (#16/#17)
  • January 22 vs. LSU (#12/#13)
  • January 29 at Texas (#7/#19)
  • February 9 at Mississippi State (#35/#44)
  • February 15 vs. Kentucky (#16/#17)
  • February 19 at Arkansas (#67/#57)
  • February 26 vs. Auburn (#8/#5)

Expected wins: 4.1 out of 8 (Torvik); 4.2 (KenPom)

I guess if you like stability, it’s worth knowing that seven of these eight are the same as they were two months ago. The only new game is home LSU on January 22, a suddenly-pivotal affair for SEC title race purposes. Tennessee projects as an underdog in three of seven, all on the road (LSU, Kentucky, Texas). Regardless of what numbers you’re using, these seven games represent the toughest, most ruthless chunk of Tennessee’s remaining schedule. The most likely outcome for each is a close, tight affair that you’re rooting for the coin flip to land in your favor.

As of now, Tennessee is 2-3 against Quadrant 1 opponents, and if they can find a way to somehow get over .500 across 13 total games (7-6, or 5-3 here), that would be quite a big win. Torvik’s numbers currently project just nine teams in all of college basketball to finish above .500 (min. 10 games) against Quadrant 1 competition. Even six Quadrant 1 wins would be pretty useful, because only 15 other teams are projected to get that many. (In the last full season of 2019-20, 18 teams did this.)

A top ten team would be expected to go either 4-4 or 5-3 against this eight-game slate; it would behoove Tennessee to get to one of the two.

Odds of various records:

  • 0-8: 0.3%
  • 1-7: 2.5%
  • 2-6: 9.3%
  • 3-5: 20.2% (5-8 overall)
  • 4-4: 27.2% (6-7 overall)
  • 5-3: 23.5% (7-6 overall)
  • 6-2: 12.5%
  • 7-1: 3.9%
  • 8-0: 0.5%

Quadrant 2

Scheduled games:

  • January 18 at Vanderbilt (#84/#89)
  • January 26 vs. Florida (#25/#38)
  • February 1 vs. Texas A&M (#81/#56)
  • February 5 at South Carolina (#121/#82)
  • March 5 vs. Arkansas (#67/#57)

Expected wins: 4.01 out of 5 (Torvik); 3.92 (KenPom)

Tennessee will be favored to win all five of these, and in the case of a couple of them (Texas A&M and South Carolina), they’re likely going to be favored by double-digits. Yet none of these five are super-sure things. They’d only be a five-point favorite at Vanderbilt right now, for example. Colorado is a Quadrant 2 game now, and remember how wobbly that felt going in. Even home Arkansas isn’t a cinch.

It’s once again worth noting the rarity of going undefeated against the second Quadrant. As of now, only one team with a minimum of four games against Q2 is projected to go undefeated (Houston). Last year, that number was also one (Baylor); in 2019-20, it was six; in 2018-19, 11. The trend is decidedly not moving in the right direction, which probably makes sense with 2021-22 possessing the highest amount of returning roster talent in the sport’s history. It will be pretty tough to go 5-0 against this group; let’s just hope that if there is a loss, it’s an understandable one.

Odds of various records:

  • 0-5: 0.03%
  • 1-4: 0.6%
  • 2-3: 5%
  • 3-2: 20.2%
  • 4-1: 41%
  • 5-0: 33.2%

Quadrant 3

Scheduled games:

  • January 5 vs. Ole Miss (#112/#112)
  • January 11 vs. South Carolina (#121/#82)
  • February 12 vs. Vanderbilt (#84/#89)
  • February 22 at Missouri (#252/#147)
  • March 1 at Georgia (#217/#239)

Expected wins: 4.57 out of 5 (Torvik); 4.5 (KenPom)

Well, all five of these teams stink in various fashion. All five have terrible losses; all five would be terrible losses if they happened. Tennessee will be double-digit favorites in all of these. As a reminder, the top 22 teams in NET in 2019-20 combined to go 135-2 against Quadrant 3 competition, which is probably a small overachievement but still gives you an idea of how bad it would feel to lose any of these games. Missouri and Georgia are actually Quadrant 4 as of now, but Torvik forecasts them to barely scrape above 240 in NET by year’s end; the less Quad 4 games you play, the better. It seems like it would be hard for either to fall below 240 simply by virtue of playing in an agreed-upon top-four conference.

The most likely outcome here is Tennessee going 5-0, and it better be. Any of these losses would be so singularly embarrassing that it would have the power to cancel out a win over, like, Kentucky. You would beat Kentucky at Rupp and still be thinking about losing to Ole Miss. Don’t do it.

Odds of various records:

  • 0-5: well, imagine a bunch of zeroes followed by a one
  • 1-4: 0.03%
  • 2-3: 0.6%
  • 3-2: 6.3%
  • 4-1: 31.3%
  • 5-0: 61.7%

So: let’s talk most likely overall records, then. Right now, Tennessee sits at 9-3, 0-1 in the SEC. Bart Torvik’s numbers project a 12-6 finish in the SEC for Tennessee, which would put them in a four-way tie for second. KenPom: 12-6, tied for third with Alabama. (They would lose this tiebreaker and be the 4 seed, which still gives you a double-bye.) ESPN’s BPI: 13-5, three-way tie for first with Kentucky and Auburn.

If you’re looking for probabilities, Bart Torvik’s numbers give Tennessee an 85.4% chance of finishing somewhere between 10-8 and 14-4 in the SEC. My opinion here is that, if you’re looking for a regular season title, it’s going to take a minimum of 14 conference wins to at least get a share of the championship. In every metric system I use, at least one team is projected for 14 right now; maybe you get some late-season luck (2017-18, as an example) and it ends up being 13. But: 14 wins is probably the goal.

The only way Tennessee can realistically get to 14 or better is by playing like a top ten team the rest of the season with essentially no serious interruptions. If they go 4-3 in their remaining games against SEC Quadrant 1 competition (losing to Texas in this scenario), they’d have to go perfect against Quadrants 2 and 3. Is that possible? Certainly; it happens in a hair under 21% of all scenarios. But that’s not probable. It merely means it can happen. Tennessee’s gotta be really, really good to make that happen. If they do indeed play like one of the ten best teams in existence, that 21% figure rises to a little under 26%.

Even so, Tennessee will find it pretty hard to find more than 13 SEC wins this year. That’s fine; it’s what I had penned in the preseason. 13-5 in an SEC with five Top 20 teams and an expectation of 7-8 NCAA Tournament teams is a very good record and would likely be enough to lock Tennessee in as no worse than a 3 seed in the NCAAs entering SEC Tournament weekend. (It also probably locks Tennessee in as no worse than a 3 seed in the SEC Tournament, for the record.)

So: that’s the situation Tennessee is in. If Auburn can find a way to be less than expected…if Kentucky keeps having hiccup games…if Alabama can simply have enough off-nights…even if LSU simply isn’t the best defense in America, Tennessee stands to benefit from it. 12 games worth of data with all preseason baselines removed have Tennessee slotted as the 12th-best team in America, per Torvik. Even including preseason, they’re 12th on KenPom. Nearly every metrics system in existence has Tennessee as somewhere between the 8th and 15th-best team in America. I promise you there’s worse positions to be in.

Tennessee’s tricky December is likely going to result in a loss or two, which is fine

I joke about two things online very often: 1. The nuthouse fervor of any and all online communities based around college athletics; 2. The fact that said nuthouse communities apply Football Mindset to other sports. When you are stuck in Football Mindset, every loss is a Big Event. Every loss that happens has the potential to change a narrative for a coach for years to come. (Unless you root for Indiana or Duke football, I guess.) It makes sense for a sport that has 12-game seasons and very few data points to apply to.

It doesn’t make sense to apply Football Mindset to college basketball, a sport with greater variance, 30+ game seasons, and a significantly higher amount of parity. Only one program (Florida) has posted back-to-back championships in the same year. No team has finished a season undefeated in 45 years. The best program over the last decade of the sport is in freaking Spokane, Washington. And yet:

I feel like this perhaps applies especially well to fan bases where football is the dominant sport. There’s nothing inherently wrong with football being the dominant sport at a school! It’s just a bit of a strange way to look at basketball, a sport where literally everyone loses at least once and in almost every season, every high-major basketball team loses 3 or more times. Heck, Tennessee’s most recent SEC basketball title came in a year where they lost five regular season conference games. The arc of history is a long one, and not everything is linear; off nights happen.

I bring all of this up because this December is Tennessee’s trickiest month of pre-January affairs they’ve had to navigate since November 2010 if not further back:

That’s an astounding five opponents ranked 57th or better in the span of four weeks. As far as I can tell, Tennessee hasn’t had a December this busy in over two decades. They’ll be favored in six of these seven games, and two are fairly obvious gimmes, but that leaves five games with a spread within three points, i.e. Literally One Possession in a Basketball Game. That’s five somewhat-weighted coin flips. Apologies to UNC Greensboro (who’s dropped 11 spots since the start of the season, FWIW, and has a new coach) and USC Upstate, but this month should be remembered by the Tier A games.

I ran the numbers on what fans can reasonably expect after remembering how you’re supposed to calculate probabilities. Here’s the rough odds of each record in this five-game stretch, based on KenPom’s numbers:

  • 0-5: 1.6%
  • 1-4: 10.4%
  • 2-3: 26.7%
  • 3-2: 34%
  • 4-1: 21.8%
  • 5-0: 5.5%

The point of this exercise is that it’s going to be very, very hard to get through this month unscathed. Bart Torvik’s TeamCast notes that even a team playing at the level of the current #1 team in metrics systems (Gonzaga) would only be expected to go 5-0 about 31% of the time. When you’re Tennessee – very good, very interesting Tennessee, but a flawed and imperfect Tennessee – your odds are understandably quite a bit shorter. Even the very best team would fail to go 5-0 against this fivesome in 69% of scenarios.

The good news here is that, 83% of the time – AKA, five out of every six – Tennessee is going to win between 2 and 4 games against this tough slate. Unless an outlier performance happens, you can count on Tennessee finding at least two wins. Even in the very worst-case scenario for an NCAA Tournament resume – one where the Volunteers only take the two ‘easiest’ wins – Tennessee would walk away with a road win over Colorado (who is 20-5 at home against Top 100 teams since 2017) and either a home win over Arizona (who looks like a legitimate Top 15 team) or a neutral site win over Texas Tech.

Consider the possibilities of the potential win triplets in the scenarios where Tennessee goes 3-2 (what a top 10-20 team would be expected to do):

  • Road win over #57 Colorado, neutral win over #29 Memphis, home win over #19 Arizona: 24.2% chance of winning all three; most likely three-team pairing
  • Road win over #57 Colorado, neutral win over #16 Texas Tech, home win over #19 Arizona: 20.2%
  • Road win over #57 Colorado, neutral win over #16 Texas Tech, neutral win over #29 Memphis: 19.8%

Or the most chaotic, most annoying, also most satisfying, and therefore funniest tri-win scenario:

  • Neutral win over #16 Texas Tech, neutral win over #29 Memphis, road win over #11 Alabama: 12.1%

I am no psychic; I do not know what will happen this month. What I do know is that if you allow yourself to understand that a two-loss month for Tennessee is Actually Good and genuinely very beneficial to the team’s fortunes in March, you’ll be a much more satisfied and well-adjusted person if that comes to fruition. (If they go 2-3 or worse, depending on the losses being close, you’re more than welcome to get a little upset.) If they go 4-1? Well, buddy, that’s icing on the cake. Any scenario where Tennessee gets four wins out of five would genuinely move them up an entire seed line and possibly two come Selection Sunday while (likely) temporarily placing them in the AP Top 10.

I have two goals in mind:

  1. Win three of the first four games (Colorado, Texas Tech, Memphis, Arizona). Any collection of wins here is great for a March resume, and it allows Tennessee (in my head, but not in reality) to go into the Alabama game with less stress.
  2. Get at least two wins away from home. Winning in front of a home crowd is nice, but you don’t play in front of home crowds in March.

Months like this are horrible and wonderful. Gone are the stress-free blowouts of Quadrant 4 teams (minus the obvious one on Tennessee’s schedule); now, you get to find out just how good Tennessee actually is. To be honest, it’s better to find out something now than to find out something at the worst possible time three months from now. This is going to be a December to remember in some aspect, but hopefully, you don’t have to sit through 500 car commercials to see it unfold.

And hey, if you like applying Football Mindset, think of it this way: you’ve only gotta go .500 to make a bowl. Tennessee only has to go .600 (roughly 7-5, which they did this season) to make this month a successful one. “Vols with two losses or fewer!” doesn’t have the same ring as “Vols by 100”, though, so do what you gotta do.

How much mid-range is too much mid-range?

Hello out there. I hope you’re trying to enjoy the dog days of summer. Every day is exactly the same; an 88-to-93 degree high, a 69-to-73 degree low. Sometimes it rains. Sometimes it doesn’t. Much like basketball, something either goes down or it stays out. This is perhaps the peak time of boredom, something we rarely get anymore with our collective addiction to social media and online life. You can zone out for minutes, even hours and realize that nothing around you has changed all that much. In its own way, it is quite nice.

More than any other time this could possibly be written, mid-August in the middle of Sludge Weather seems like the ideal time to continue the Mid-Range Discourse.

AFTER THE JUMP: The Discourse begins anew

Continue reading “How much mid-range is too much mid-range?”

Exploring somewhat-sane proposals for the 346-team NCAA Tournament

Like a bolt of lightning in the dead late-summer air came this tweet across my timeline:

Content! Beautiful content. The ACC has achieved what the most daydream-prone among us have hoped for: pure, uncontrollable chaos. Nothing about a 346-team NCAA Tournament (11 of Division I’s 357 programs are ineligible for this year’s Tournament for various reasons) is normal at all, and all it can bring is something wild. Imagine the takes if 1 seed Villanova loses to 346 seed Mississippi Valley State in the shocker of a lifetime!

Of course, that exact scenario takes numerous leaps of logic to achieve. A straight 346-team tournament isn’t possible without either a laundry list of byes or play-in rounds. Everyone knows the NCAA Tournament loves money, and such a massive loss to a star team would be a monetary dent in terms of viewership and advertising dollars, both of which the NCAA needs in droves (apparently!) after the cancellation of the 2020 NCAA Tournament. That’s why I’d offer The Will Warren Somewhat Sane Solution. It is not the Everyone’s Easy Solution That Just Adds a Couple Extra Games.

(Quick aside: you can just turn the Field of 64 into the Field of 256 by having one play-in round for teams seeded 167 through 346, protecting the top 166. It’s not a bad idea, but forcing the top teams to win eight straight games instead of six both seems a little nuts and seems like it could massively overwhelm host cities. We’re assuming no/limited crowds for the purpose of this experiment, and having even 16 teams podded up in one city probably means at least a couple of hotels at full capacity. I went to school for English, not Hotel Management, so maybe this is actually fine, but who knows.)

Here is the Official guide to a plan I cooked up yesterday afternoon, along with questions I still have to answer:

1. A ladder system that protects the top 32 teams.

In order to ensure that proper respect is paid to teams that have a lot of success during the conference-only regular season (another assumption that I’m running with), I’ve instituted a system that gives the 32 best* teams a free run to the Field of 64. It’s how it would work in a normal season, so it seems fair to keep this part. What this means is that 32 teams out of the remaining 314 will have to play their way into the Field of 64 by way of our 1-to-346 seeded ladder system.

What’s a ladder system? Think of it the way they run it in the Korean Baseball League.

  • The fifth-seeded team plays the fourth-seeded team.
  • The winner plays the third-seeded team.
  • That winner plays the second seed…
  • And finally, that winner gets to play the first seed.

It’s a testament to how well you can sustain your success if you make it all the way up the ladder, and it rewards those who’ve had full-season success as opposed to those who get hot for a few games. How does our ladder system work?

2. Six play-in rounds, spread out over 10-14 days at neutral sites, that slowly whittle the field from 346 to 64 teams.

Bear with me here. This is pretty nuts, I’ll admit, but so’s the idea of a 346-team college basketball tournament in a sport ripe with variance. Anything can happen in any one game, which is why we’re introducing this ladder system as opposed to the 166-team protection. This enables full-season success to matter, while allowing a team to run their way from the bottom to the big time if they’re hot. It attempts to simulate Conference Championship Week in some form, though with more rounds than any individual conference championship.

Here’s how it works. Teams are reseeded by round; i.e., if the #334 team wins in the first round but no team below them wins, they will play the #212 seed in the second, and so on.

  • Teams seeded 257-346 (90 teams total) will play each other from top to bottom – 257 vs. 346, 258 vs. 345, 259 vs. 344, etc. – in order to eliminate 45 teams. This leaves us with 301 teams after one round.
  • Teams seeded 212-256 (45 teams) will play the first round winners to eliminate another 45 teams, giving us 256 teams after two rounds.
  • Now, we could go right into a 256-team field and stop here. If we don’t, we have a third play-in round that gets the field to 192 teams by way of teams seeded 129-211 playing the second-round winners.
  • For the fourth round, teams seeded 65-128 will play the third-round winners, pushing the field to 128 teams.
  • The fifth round features the teams seeded 33-64 and the fourth-round winners for a total of 48 games being played, eliminating 48 teams to get to 80.
  • Now – finally – our final play-in round allows for teams seeded 49-80 to play each other for the right to be in the field of 64.

This is very much silly, but it also works. Teams are forced to climb their way up the ladder system to earn their spot in the NCAA Tournament in a system that somewhat simulates conference tournaments with much less structure and more chaos. You like chaos, right?

3. Alternately, the same plan, but with four play-in rounds and a 128-team field.

This allows for a shorter time period and is less complicated. Again, teams are reseeded after reach relevant round; if #340 beats #263 but no other team below them wins, they would play #212 in the next round.

  • Teams seeded 257-346 (90 teams total) will play each other from top to bottom – 257 vs. 346, 258 vs. 345, 259 vs. 344, etc. – in order to eliminate 45 teams. This leaves us with 301 teams after one round.
  • Teams seeded 212-256 (45 teams) will play the first round winners to eliminate another 45 teams, giving us 256 teams after two rounds.
  • A third play-in round that gets the field to 192 teams by way of teams seeded 129-211 playing the second-round winners.
  • For the fourth round, teams seeded 65-128 will play the third-round winners, pushing the field to 128 teams.
  • The Tournament is then seeded where 1 plays 128, 2 plays 127, and so on, with aims at ensuring region vs. region play.

Question: What about automatic qualifiers from non-Big Six conferences? We’ll have to work that out. Ostensibly, we could turn the Top 32 into the 32 conference champions/standings leaders at season’s end and it would work out just as well. Then, the final 32 spots are made up of the 32 teams that survive our ladder/play-in system. However…doesn’t it feel kind of weird to have a field where, say, 272nd-ranked-in-KenPom North Carolina Central is guaranteed a spot but 3rd-ranked Baylor isn’t? To be determined, folks. Though if you’re the third-best team in college basketball, you should be able to win against whoever you draw no matter what.

Question: How do we ensure smaller, lower-seeded schools can actually play each other? There’s a clear issue here, and I’m not totally sure how to resolve it under this format. For instance, what if Albany (in New York) draws Florida A&M (very much not in New York) in the first round? That’s a lot of travel costs we’d have to work out, and it likely isn’t worth it for Florida A&M. The best thing we can do is have one city be the host to as many games as possible, similar to the actual Field of 64. Perhaps for this specific example, the two teams could play in Washington D.C. at a neutral site. Someone smarter than me probably has an idea on how to do pods for this, and obviously, the 256-team field is much easier to work out. But it’s also not nearly as protective of those who’ve earned the right to be there.

Question: How long would both plans take? For the six play-in round structure, I think it could be accomplished over the course of 10-14 days – AKA, how long conference championship “week” usually takes – at multiple neutral court sites. We’d have to stuff 314 teams in no more than four cities, but I’d say it’s at least somewhat doable. For the four-round structure, we could realistically accomplish this in anywhere from 6-10 days. Again, this stuffs a lot of teams in no more than four bubble cities, but it also cuts the number of play-in teams from 314 to 218. However, it creates much more variance.

Question: Maybe a 96-team field? Sure! The in-between plan, which the NCAA almost implemented ten years ago. Just take the four-round plan listed above and add a fifth-round between teams seeded 65-128.