

This is a simple post. It’s the most efficient men’s college basketball offenses of the 2020-21 season, a continuation of a project I’ve done in years prior.
First up, the Synergy Sports section. This one is pretty simple: it’s the 20 best offenses of the season, as determined by a minimum number of possessions (1100 or more). Normally, I don’t really have to filter out many teams, but there was a huge variety in how many games teams were able to play this season thanks to COVID-19. Two of the teams in the top 20 here only played 13 games, while one played 35. We’ve never had that much of a disparity in games played, and hopefully, we’ll never have it again.
Something unusual also happened: there was a four-way tie for 19th, which means this list is 22 teams long instead of 20. I’ve included the extra two, because they shouldn’t be excluded arbitrarily.
The difference between this section and the next is a simple one. Synergy includes offensive rebounds as separate possessions; most other places out there count them as part of the same possession. I’ve included both calculations.
Honorable Mentions: Fairmont State (1.015 PPP), Virginia (1.017), Bellarmine (1.018).
T-19. William Penn University Statesmen (Oskaloosa, IA)

- Points Per Possession: 1.019
- Best Play Types (90th-percentile or higher): P&R Ball Handler (93rd-percentile)
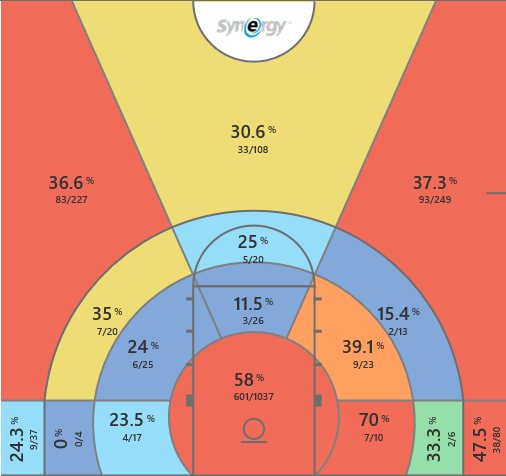
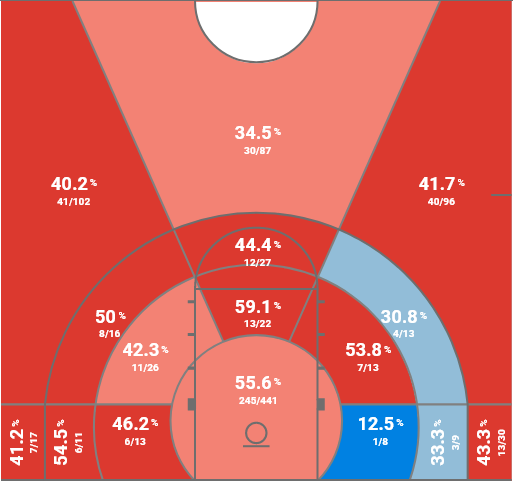
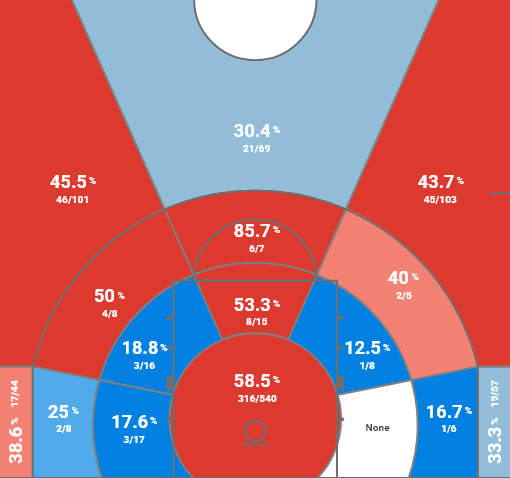
- Percentage of Shots Attempted: 49.7% Rim, 11.6% Non-Rim Twos, 38.7% Threes
- Shots Made by Category: 68.3% Rim, 45.5% Non-Rim Twos, 32.2% 3PT
- Tempo: 84.29 possessions (would rank 1st of 347 teams in D-1)
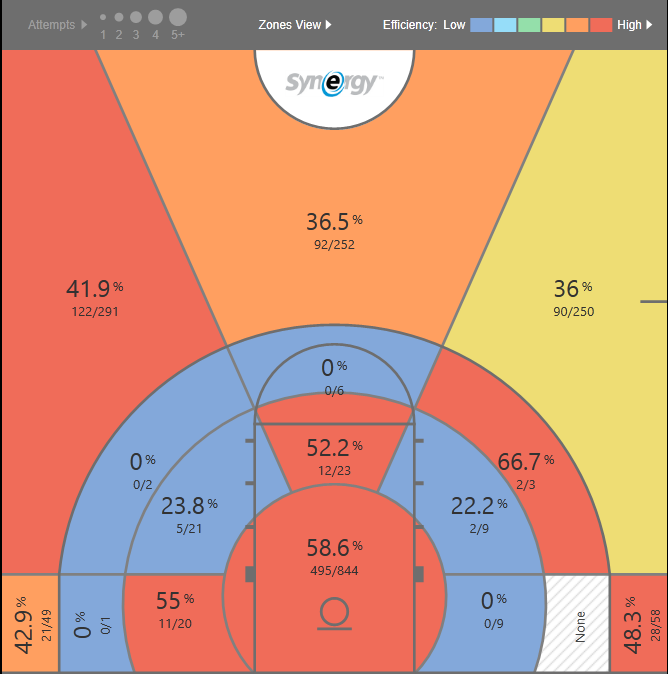
T-19. St. Edward’s Hilltoppers (Austin, TX)

- Points Per Possession: 1.019
- Best Play Types (90th-percentile or higher): Isolation (95th), Spot-Up (92nd)
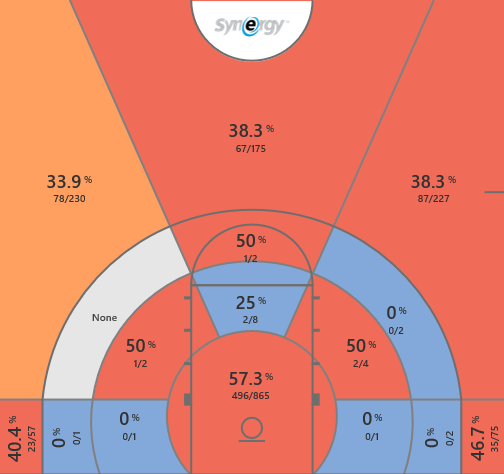
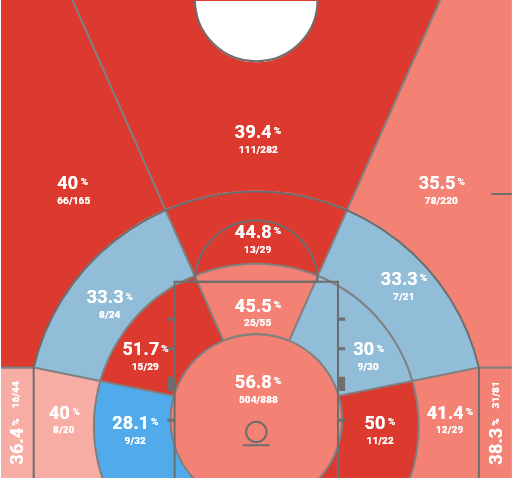
- Percentage of Shots Attempted: 31.3% Rim, 20.4% Non-Rim Twos, 48.3% Threes
- Shots Made by Category: 65.4% Rim, 42.3% Non-Rim Twos, 36.9% 3PT
- Tempo: 72.76 possessions (37th of 347)
T-19. Marietta Pioneers (Marietta, OH)
- Points Per Possession: 1.019
- Best Play Types (90th-percentile or higher): Spot-Up (97th), Off-Screen (93rd)
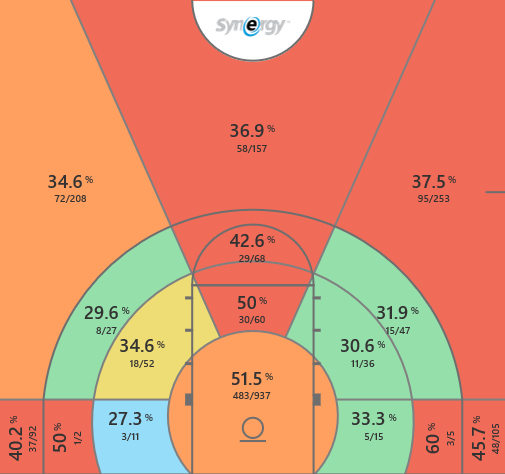
- Percentage of Shots Attempted: 38.4% Rim, 25.9% Non-Rim Twos, 35.7% Threes
- Shots Made by Category: 60.9% Rim, 40.7% Non-Rim Twos, 39.5% 3PT
- Tempo: 74.98 possessions (8th of 347)
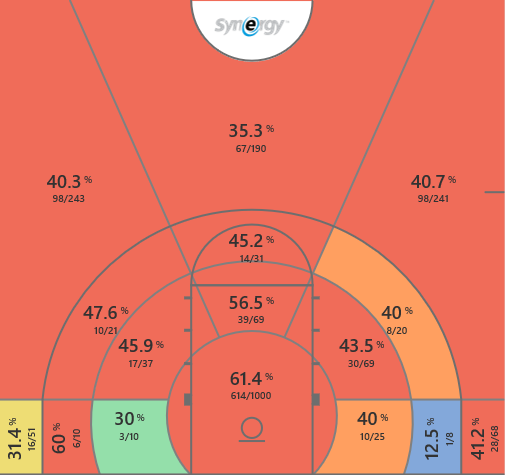
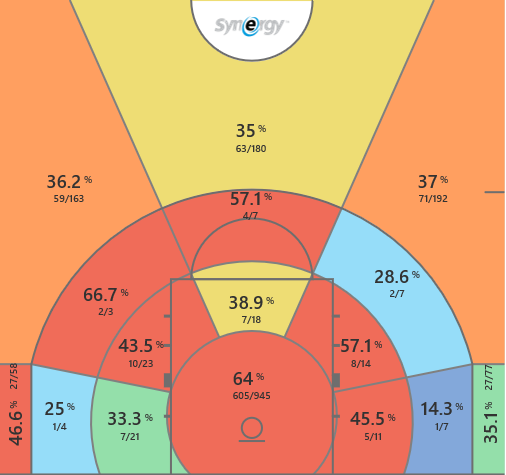
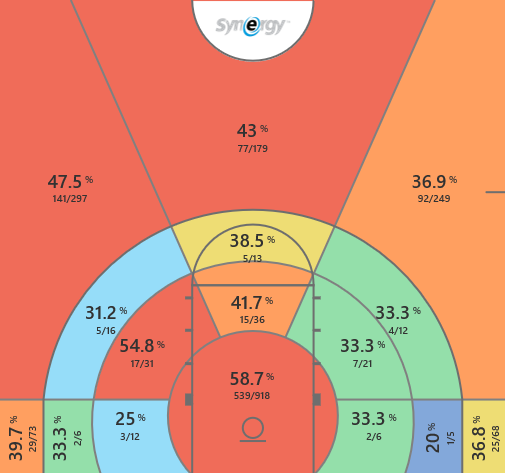
T-19. Iowa Hawkeyes (Iowa City, IA)
- Points Per Possession: 1.019
- Best Play Types (90th-percentile or higher): Spot-Up (97th), Post-Up (97th)
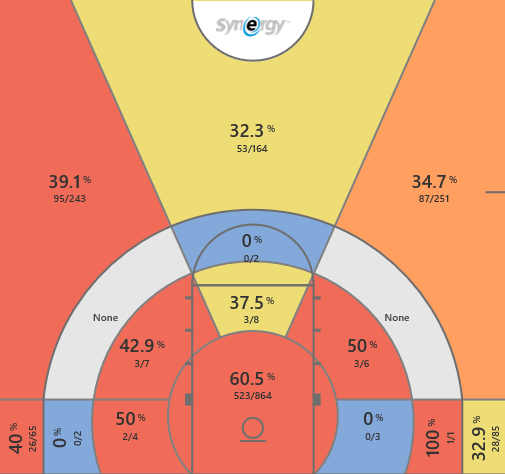
- Percentage of Shots Attempted: 35.9% Rim, 24.3% Non-Rim Twos, 39.8% Threes
- Shots Made by Category: 62% Rim, 38.8% Non-Rim Twos, 38.6% 3PT
- Tempo: 70.8 possessions (98th of 347)
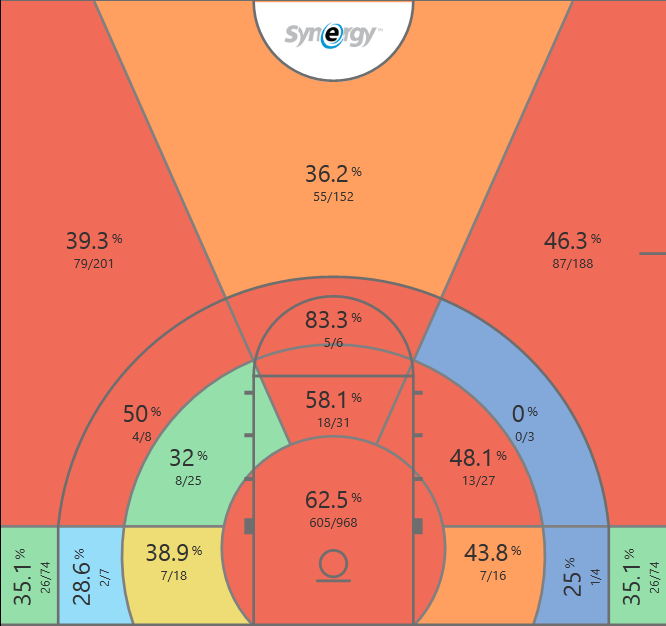
T-17. Marian Knights (Indianapolis, IN)

- Points Per Possession: 1.021
- Best Play Types (90th-percentile or higher): Transition (100th), Post-Up (92nd)
- Percentage of Shots Attempted: 40% Rim, 26.5% Non-Rim Twos, 33.5% Threes
- Shots Made by Category: 61.3% Rim, 43.4% Non-Rim Twos, 35.6% 3PT
- Tempo: 68.9 possessions (183rd of 347)
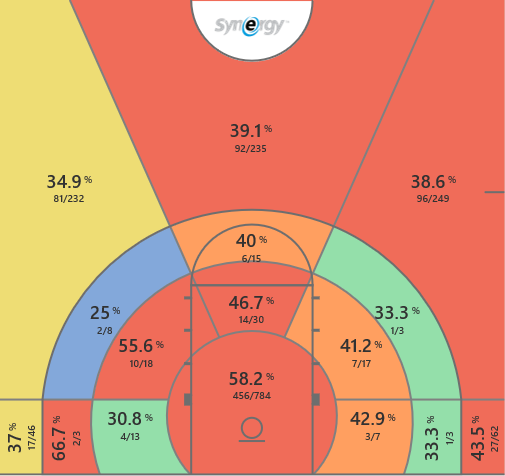
T-17. Hillsdale Chargers (Hillsdale, MI)

- Points Per Possession: 1.021
- Best Play Types (90th-percentile or higher): P&R Ball Handler (98th), Post-Up (97th), Cut (95th)
- Percentage of Shots Attempted: 44.2% Rim, 20.7% Non-Rim Twos, 35.1% Threes
- Shots Made by Category: 66.7% Rim, 39.1% Non-Rim Twos, 35.6% 3PT
- Tempo: 67.8 possessions (233rd of 347)
16. Colgate Raiders (Hamilton, NY)
- Points Per Possession: 1.033
- Best Play Types (90th-percentile or higher): Spot-Up (100th), Transition (97th), Cut (90th)
- Percentage of Shots Attempted: 47.2% Rim, 16.5% Non-Rim Twos, 36.4% Threes
- Shots Made by Category: 61.3% Rim, 34.5% Non-Rim Twos, 40.5% 3PT
- Tempo: 72.6 possessions (44th of 347)
T-14. Weber State Wildcats (Ogden, UT)

- Points Per Possession: 1.035
- Best Play Types (90th-percentile or higher): Spot-Up (100th), Cut (97th)
- Percentage of Shots Attempted: 36% Rim, 25.8% Non-Rim Twos, 38.2% Threes
- Shots Made by Category: 67.3% Rim, 44% Non-Rim Twos, 38.9% 3PT
- Tempo: 71.5 possessions (78th of 347)
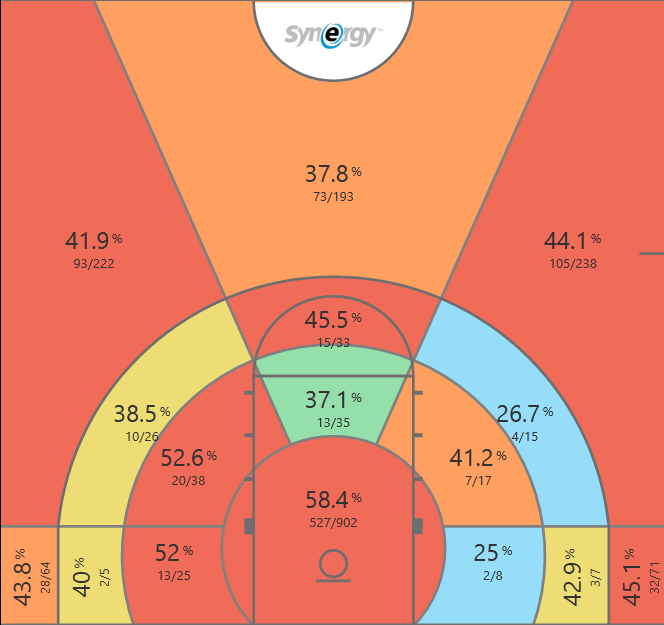
T-14. Dubuque Spartans (Dubuque, IA)

- Points Per Possession: 1.035
- Best Play Types (90th-percentile or higher): Spot-Up (97th), Transition (95th), P&R Ball Handler (92nd)
- Percentage of Shots Attempted: 33.6% Rim, 30.6% Non-Rim Twos, 35.8% Threes
- Shots Made by Category: 55.2% Rim, 45.8% Non-Rim Twos, 44.6% 3PT
- Tempo: 74.23 possessions (18th of 347)
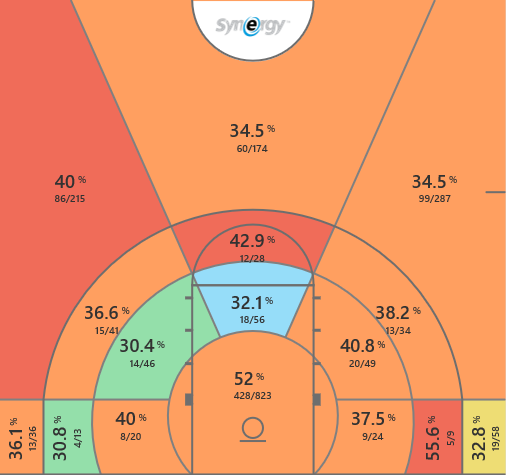
13. West Texas A&M Buffaloes (Canyon, TX)

- Points Per Possession: 1.036
- Best Play Types (90th-percentile or higher): Transition (94th)
- Percentage of Shots Attempted: 33.7% Rim, 21.9% Non-Rim Twos, 44.4% Threes
- Shots Made by Category: 65.2% Rim, 41.3% Non-Rim Twos, 36.6% 3PT
- Tempo: 75.21 possessions (8th of 347)
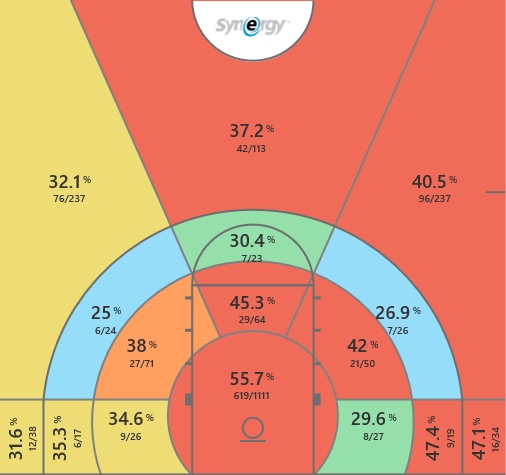
12. West Liberty Hilltoppers (West Liberty, WV)

- Points Per Possession: 1.038
- Best Play Types (90th-percentile or higher): none; highest Off-Screen (89th)
- Percentage of Shots Attempted: 45.3% Rim, 14.5% Non-Rim Twos, 40.2% Threes
- Shots Made by Category: 60.8% Rim, 46% Non-Rim Twos, 36% 3PT
- Tempo: 82.44 possessions (1st of 347)
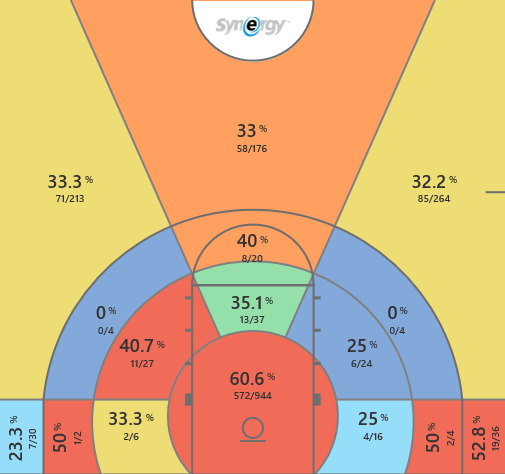
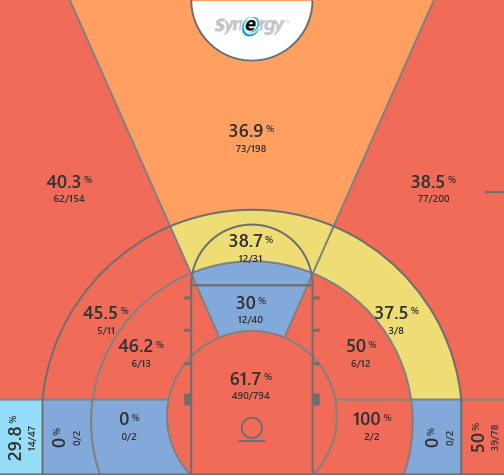
11. Liberty Flames (Lynchburg, VA)

- Points Per Possession: 1.042
- Best Play Types (90th-percentile or higher): Spot-Up (99th), Transition (96th), P&R Ball Handler (92nd)
- Percentage of Shots Attempted: 39.2% Rim, 13.3% Non-Rim Twos, 47.4% Threes
- Shots Made by Category: 61.7% Rim, 45.3% Non-Rim Twos, 39% 3PT
- Tempo: 64.7 possessions (334th of 347)
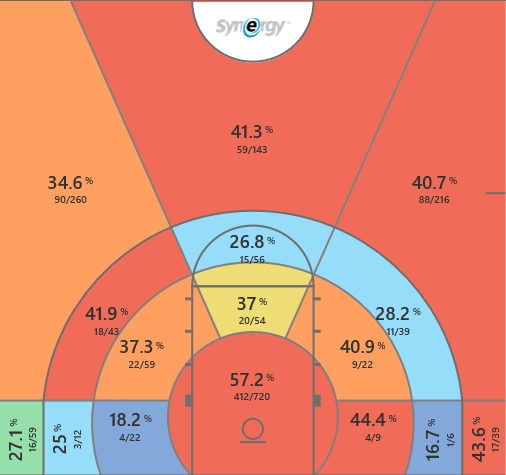
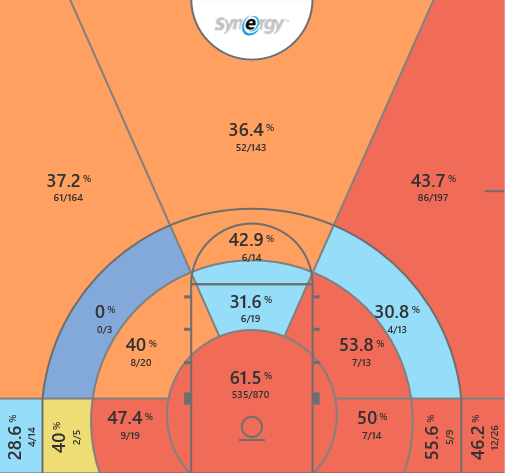
10. Charleston Golden Eagles (Charleston, WV)

- Points Per Possession: 1.048
- Best Play Types (90th-percentile or higher): Cut (100th), Spot-Up (98th)
- Percentage of Shots Attempted: 43% Rim, 15.8% Non-Rim Twos, 41.2% Threes
- Shots Made by Category: 69% Rim, 40.5% Non-Rim Twos, 37.4% 3PT
- Tempo: 70.7 possessions (102nd of 347)
T-8. Westmont Warriors (Santa Barbara, CA)

- Points Per Possession: 1.052
- Best Play Types (90th-percentile or higher): Spot-Up (100th), Transition (98th)
- Percentage of Shots Attempted: 41.2% Rim, 16.6% Non-Rim Twos, 42.2% Threes
- Shots Made by Category: 64.4% Rim, 47.6% Non-Rim Twos, 38.4% 3PT
- Tempo: 78.71 possessions (2nd of 347)
T-8. Huntington University Foresters (Huntington, IN)

- Points Per Possession: 1.052
- Best Play Types (90th-percentile or higher): P&R Ball Handler (9th), Transition (97th), Spot-Up (94th), Post-Up (93rd)
- Percentage of Shots Attempted: 37.9% Rim, 17.8% Non-Rim Twos, 44.3% Threes
- Shots Made by Category: 63.1% Rim, 52% Non-Rim Twos, 37.1% 3PT
- Tempo: 74.16 possessions (18th of 347)
7. Dallas Baptist Patriots (Dallas, TX)

- Points Per Possession: 1.07
- Best Play Types (90th-percentile or higher): Spot-Up (100th), Post-Up (98th), Transition (91st), P&R Ball Handler (90th)
- Percentage of Shots Attempted: 39.2% Rim, 16.1% Non-Rim Twos, 44.7% Threes
- Shots Made by Category: 66.4% Rim, 50.5% Non-Rim Twos, 39.9% 3PT
- Tempo: 73.84 possessions (22nd of 347)
6. Northwestern College Red Raiders (Orange City, IA)

- Points Per Possession: 1.071
- Best Play Types (90th-percentile or higher): Spot-Up (99th), Transition (99th), Post-Up (97th), Isolation (95th)
- Percentage of Shots Attempted: 40.9% Rim, 21% Non-Rim Twos, 38.1% Threes
- Shots Made by Category: 69% Rim, 45.3% Non-Rim Twos, 39.2% 3PT
- Tempo: 72.77 possessions (36th of 347)
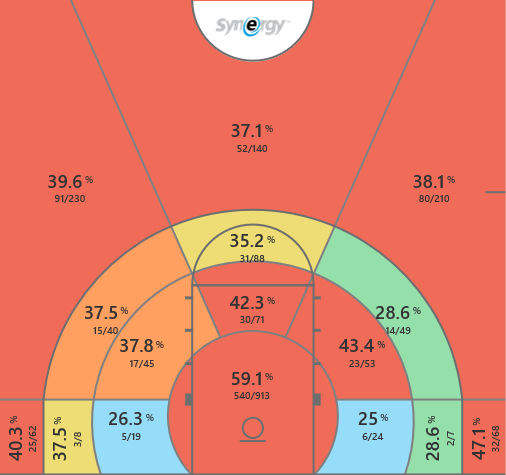
5. Lincoln Memorial Railsplitters (Harrogate, TN)

- Points Per Possession: 1.075
- Best Play Types (90th-percentile or higher): Spot-Up (97th), Transition (95th), Cut (91st), Hand-Off (91st)
- Percentage of Shots Attempted: 45.8% Rim, 8.8% Non-Rim Twos, 45.4% Threes
- Shots Made by Category: 67% Rim, 35.9% Non-Rim Twos, 40.9% 3PT
- Tempo: 77.35 possessions (2nd of 347)
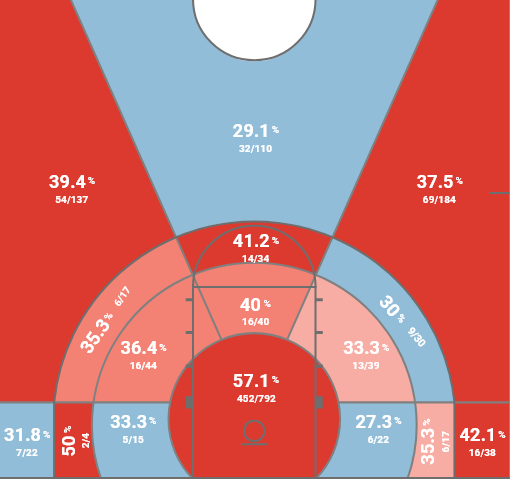
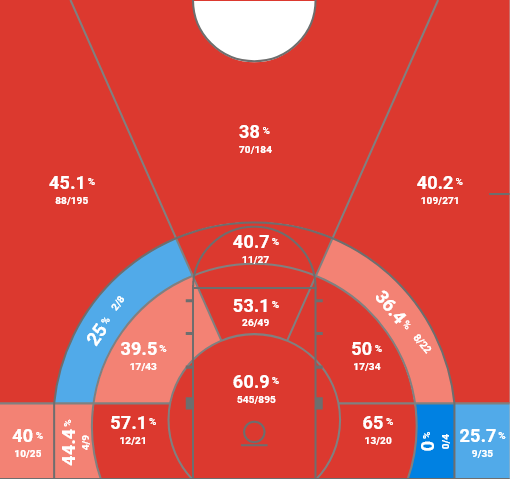
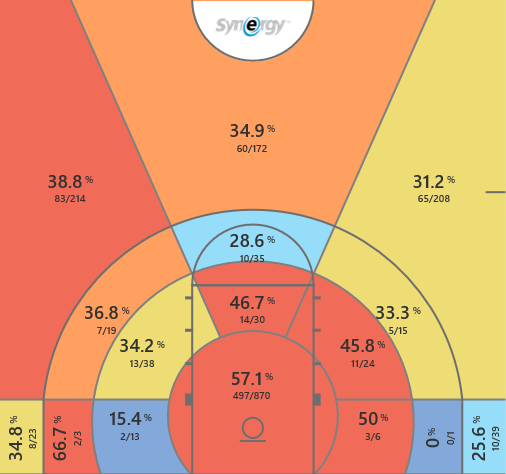
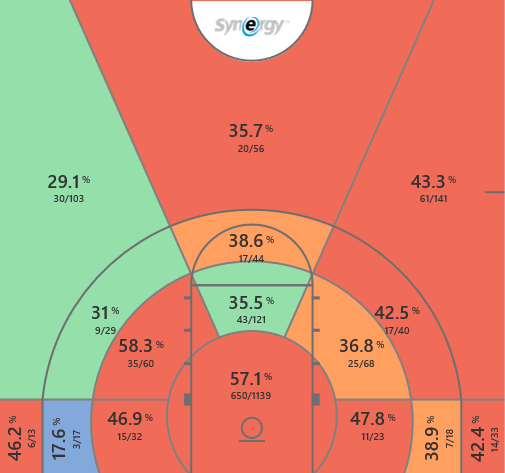
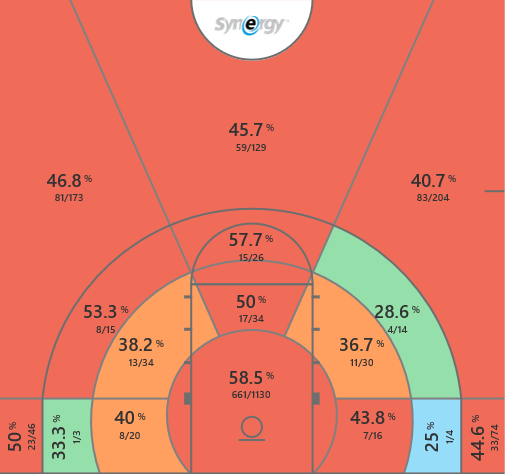
4. Indiana Wesleyan Wildcats (Marion, IN)
- Points Per Possession: 1.084
- Best Play Types (90th-percentile or higher): Cut (98th), Post-Up (98th), Transition (91st)
- Percentage of Shots Attempted: 48.1% Rim, 19.2% Non-Rim Twos, 32.7% Threes
- Shots Made by Category: 68% Rim, 43.5% Non-Rim Twos, 37.9% 3PT
- Tempo: 78.75 possessions (2nd of 347)
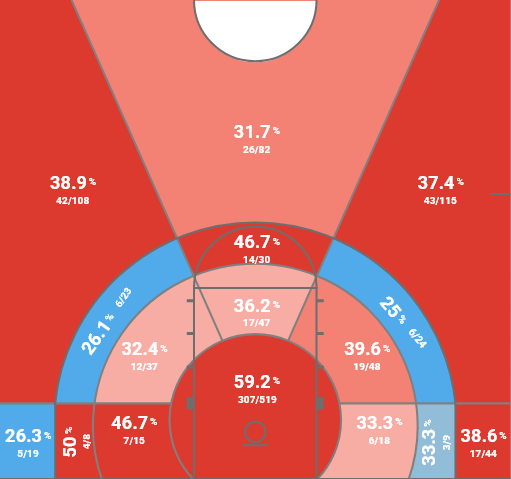
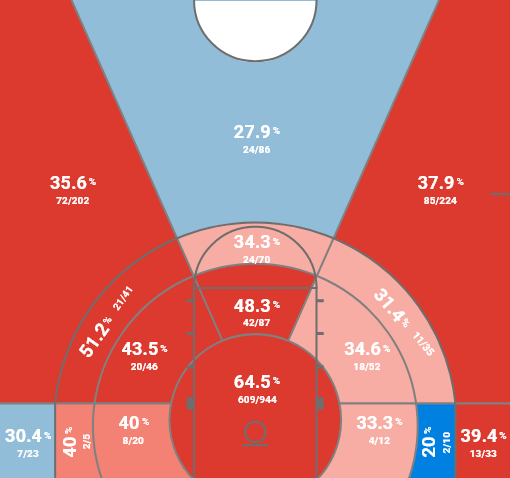
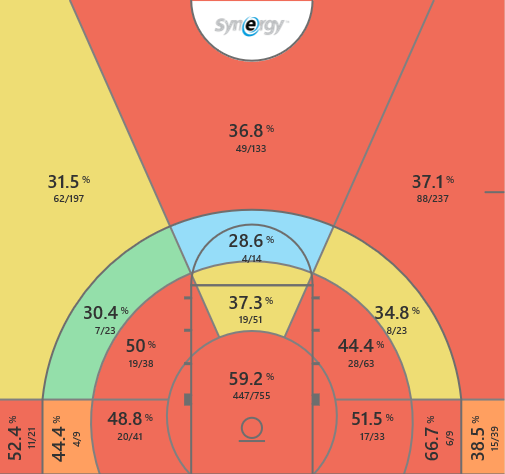
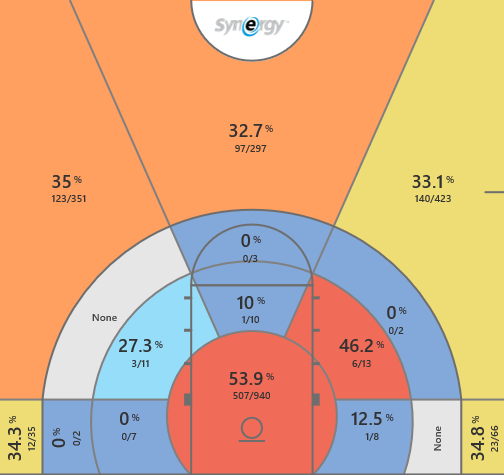
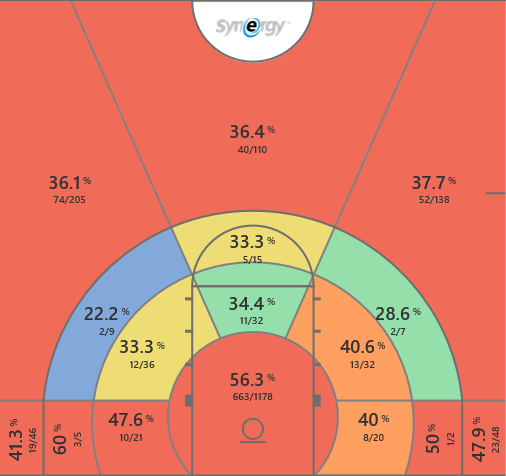
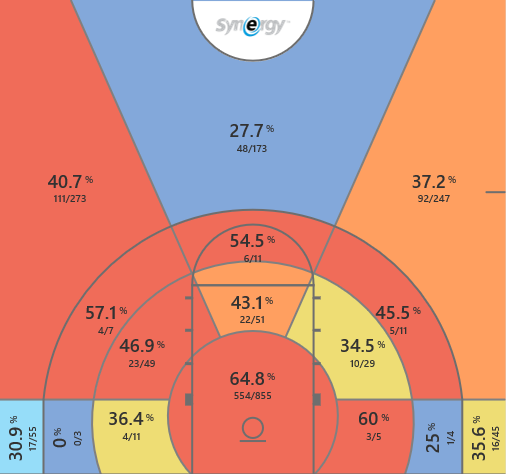
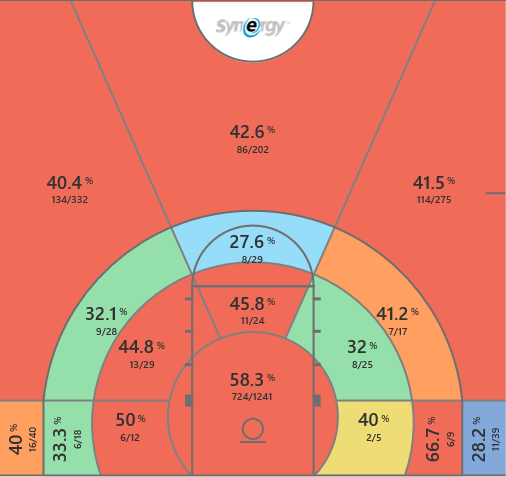
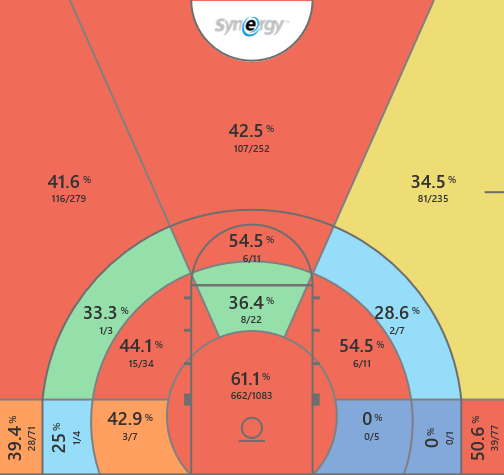
3. Gonzaga Bulldogs (Spokane, WA)

- Points Per Possession: 1.085
- Best Play Types (90th-percentile or higher): Post-Up (100th), Cut (99th), Transition (97th), P&R Ball Handler (97th), P&R Roll Man (97th)
- Percentage of Shots Attempted: 48.2% Rim, 18.5% Non-Rim Twos, 33.2% Threes
- Shots Made by Category: 72.6% Rim, 41.5% Non-Rim Twos, 36.8% 3PT
- Tempo: 74.3 possessions (14th of 347)
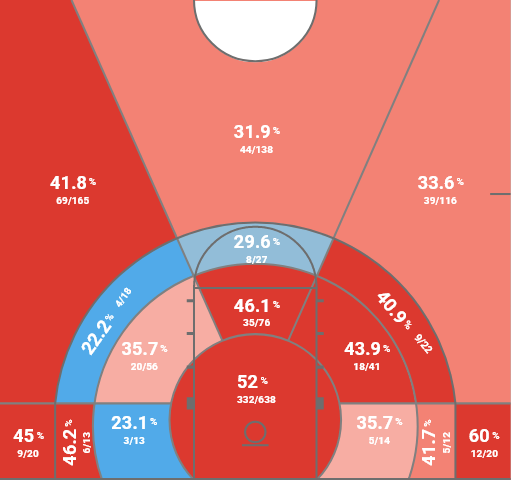
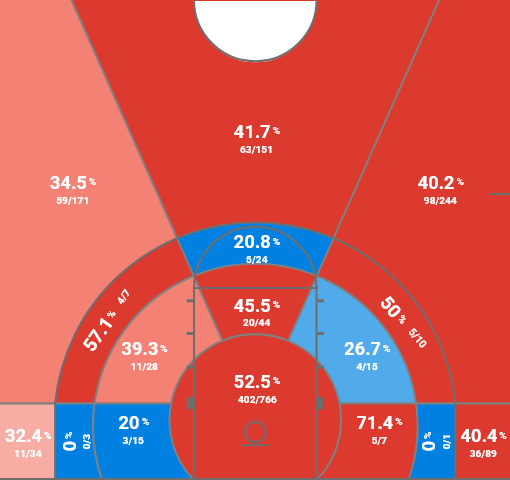
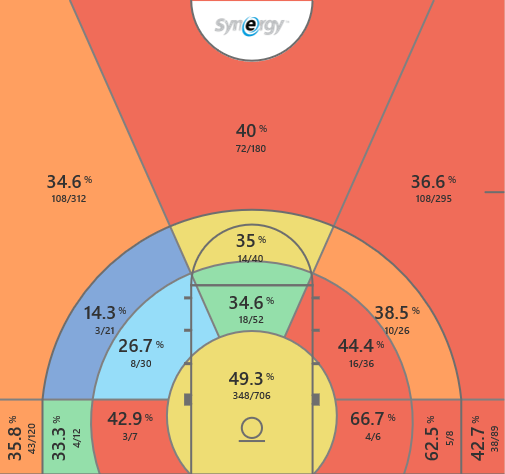
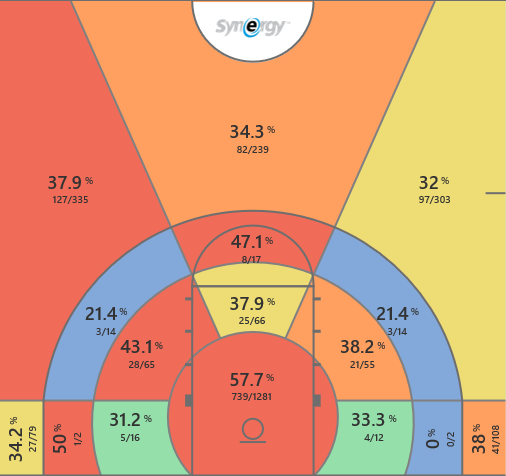
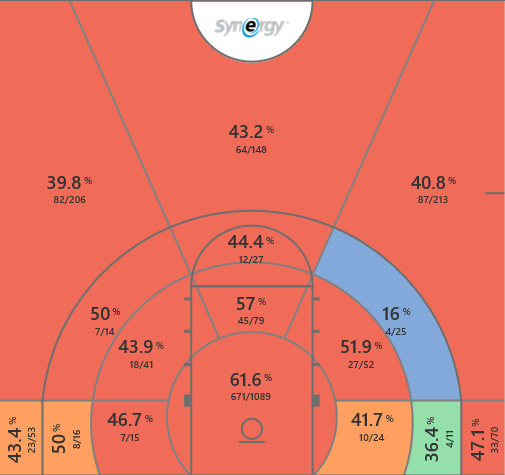
2. Lubbock Christian Chaps (Lubbock, TX)

- Points Per Possession: 1.114
- Best Play Types (90th-percentile or higher): Everything except P&R Ball Handler and P&R Roll Man were in the 92nd-percentile or higher.
- Percentage of Shots Attempted: 37.2% Rim, 21.4% Non-Rim Twos, 41.4% Threes
- Shots Made by Category: 65.9% Rim, 46.8% Non-Rim Twos, 43% 3PT
- Tempo: 66.7 possessions (#285 of 347)
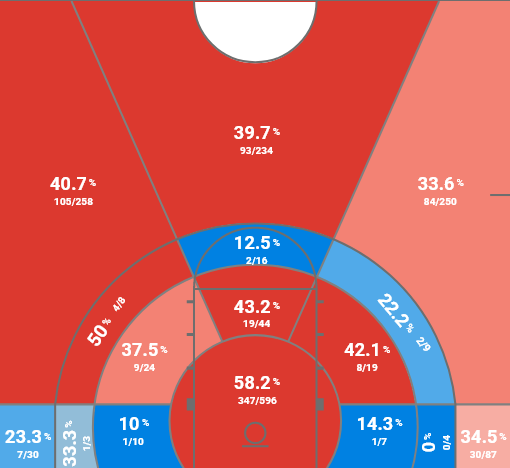
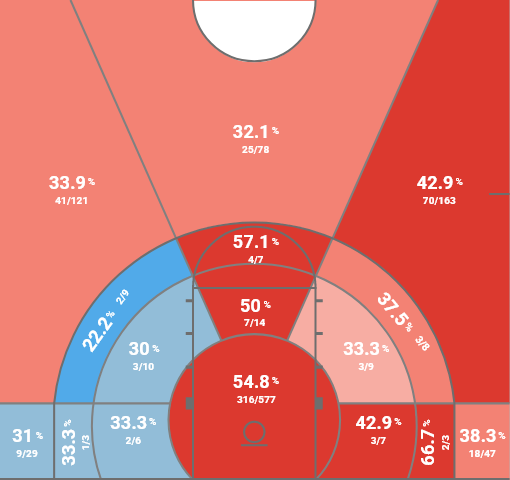
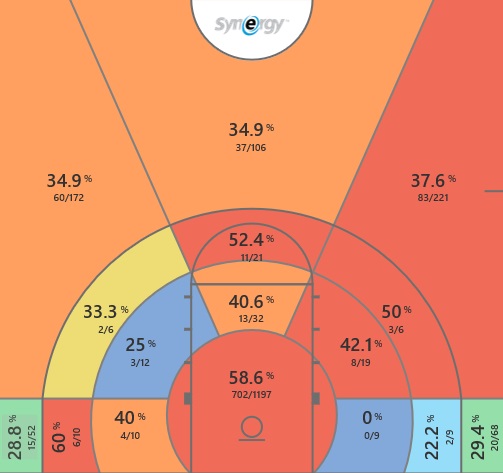
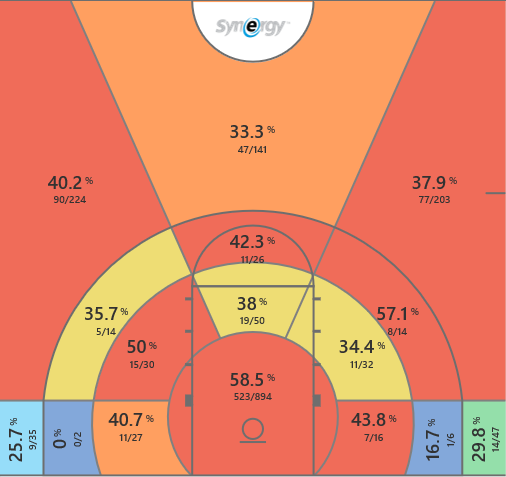
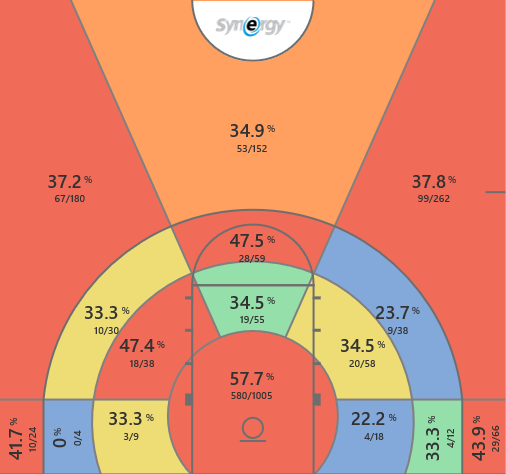
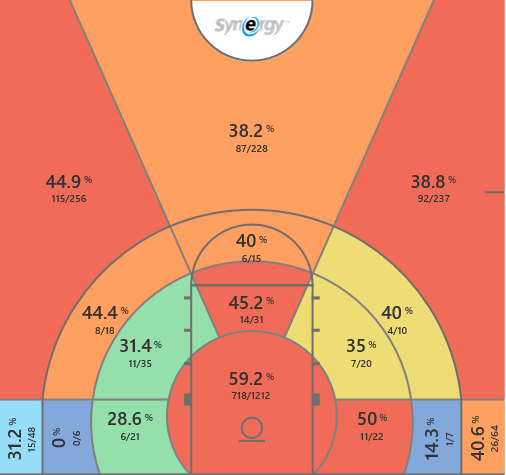
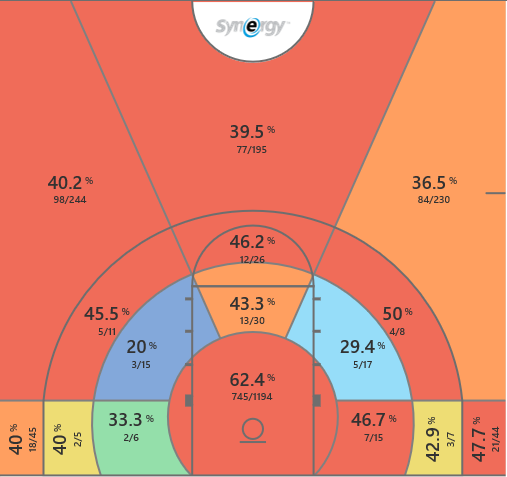
1. Northwest Missouri State Bearcats (Maryville, MO)
- Points Per Possession: 1.12
- Best Play Types (90th-percentile or higher): Literally every single play type that isn’t putbacks.
- Percentage of Shots Attempted: 42.1% Rim, 11.5% Non-Rim Twos, 46.4% Threes
- Shots Made by Category: 67.6% Rim, 41.9% Non-Rim Twos, 42.2% 3PT
- Tempo: 65.7 possessions (#317 of 347)
NEXT PAGE: Top 20 via traditional possession calculations