Restart Reviews: Jazz/Pelicans, July 30

Welcome to a new series on Stats By Will titled Restart Reviews, where I’ll be discussing a game from the previous day or two and going in-depth on its result. The goal is to post these three times a week, with next week’s edition(s) likely featuring multiple games in each. There will be GIFs, stats, and all of the general moods and feelings you likely expect by clicking on this site. I hope you enjoy.

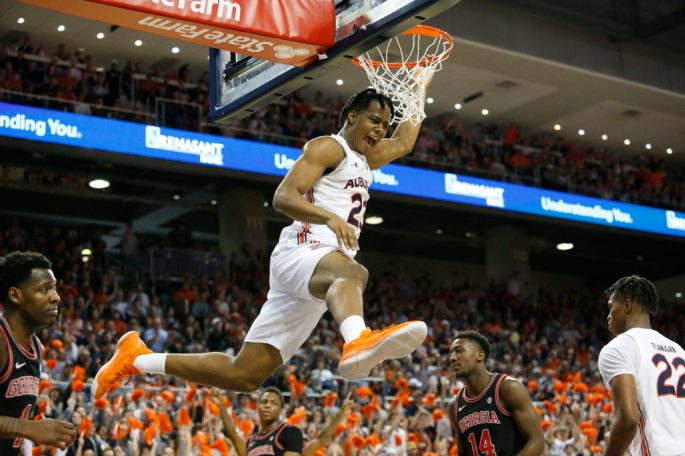
With six seconds left in last night’s game between the Jazz and the Pelicans, there was only one question on everyone’s mind watching: where is Zion Williamson? The young, special forward from Duke played 15 minutes, scoring 13 points on 6-of-8 shooting, and any time he was on the court, the New Orleans offense looked significantly better than when he was off. In Zion’s game time, he scored 13 of the Pelicans’ 30 points, and it was difficult to slow him down at any point.

But: New Orleans left him off the floor for the most important play of the game, Brandon Ingram (23 points) missed a step-back three, and New Orleans lost a badly-needed game, 106-104. This one felt especially painful, because New Orleans led by as many as 16 and controlled the flow of the game for most of the first 3.5 quarters. Considering how efficient Zion was, and how New Orleans is at their best when he plays, it didn’t make a ton of sense to leave him out for the finish, minutes restriction or not. After the game, Alvin Gentry said they played him as much as the medical staff allowed, which is a fine and acceptable answer. At the same time, I would imagine Alvin Gentry wants a job in 2021. Zion could’ve played six more seconds.

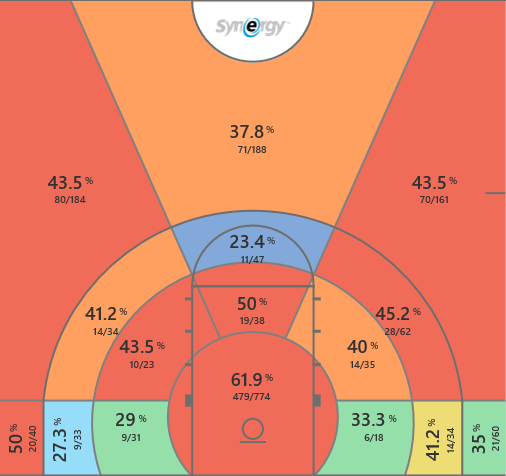
The Jazz struggled to slow down Zion, obviously, but the two-headed monster of Brandon Ingram and Jrue Holiday both scored plenty, too:

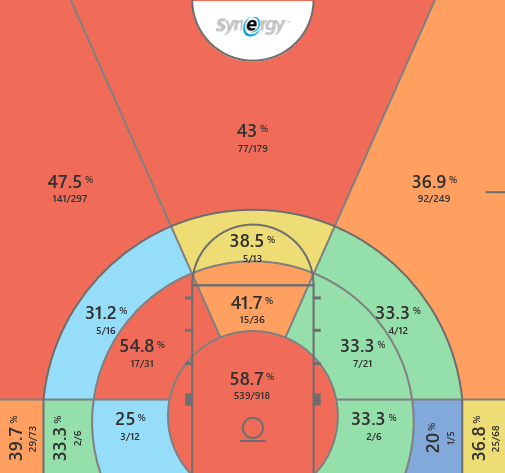
The issue here is that neither was particular efficient. Holiday was a tad better, getting to 20 points on 9-of-18 shooting, but he also committed six turnovers against a Jazz defense that isn’t exactly aggressive on the perimeter. Ingram, meanwhile, got to 23 points on the back of seven free throws and a middling 7-of-20 outing. Ingram never seemed to find his consistent stroke either from the perimeter (2-of-8) of from mid-range (3-of-9); the Jazz tried to force him away from the rim, and it mostly worked. The most surprising outing in this game Pelicans-wise was a fantastic offensive outing by J.J. Redick (21 points):

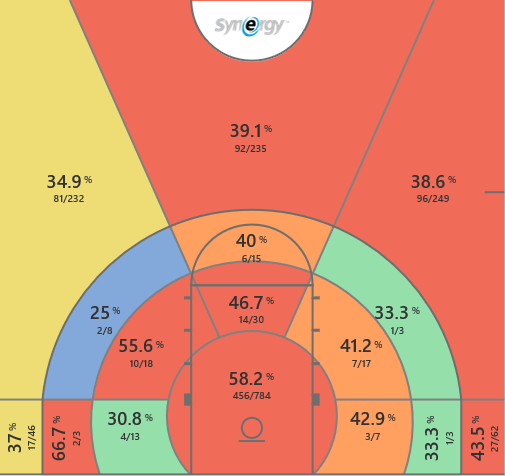
Redick flashed his typical deep-shooting skills in this one, especially in transition, but he was solid in mid-range, too. With three guys scoring 20+ points and Zion performing excellently in limited time, it did feel like the Pelicans were going to steal this one. Enter Lonzo Ball, who had one of his worst games since his rookie season:

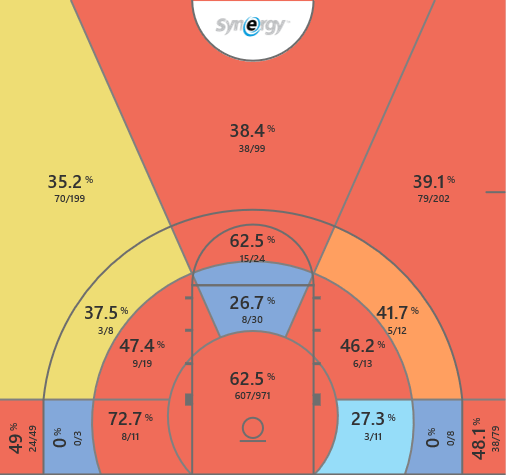
It was kind of a strange night: Lonzo got several good shots, including a couple of wide-open threes, that just didn’t go down. If it had just been that, you could shrug it off and move on…but Lonzo was also atrocious at the rim. Ball missed four layup attempts in this one, clearly influenced by Utah’s stout rim protection with Rudy Gobert, who we’ll talk about shortly. Shooters shoot, obviously, but considering Ball missed both of his free throw attempts in this one, it might have been a night for him to lay back.

For the Jazz, it was their own sort of strange night, too. When I wrote my NBA Restart preview last week, I mentioned that the Jazz had serious issues with outshooting other teams, but failing to win because they lose the shot volume game frequently. Utah doesn’t force many turnovers, has turnover issues themselves, and has quietly not been a great rebounding team offensively. They’ve been very reliant this year on hitting threes to get them over the top on bad shot volume nights, and when they go 8-of-34 from deep as they did in this one, you’re probably right to expect a loss. Add on that Utah actually did lose the shot volume game (-5.5 shot equivalents) and it’s a miracle they won.

Well, they did! The reason is fairly simple, and also not, but let’s start with the most obvious factor: free throws. The Jazz got ten more attempts than New Orleans despite having roughly the same amount of rim/short-range attempts. You could argue that New Orleans got a couple fewer calls than they should have, and I’d hear it out, but it felt as if Utah was simply more aggressive for large stretches of the game:

That, along with some fantastic half-court defense, earned Utah the victory. New Orleans demolished Utah’s weak transition defense in this one, outscoring the Jazz 27-10 in transition. On a normal night, that probably would’ve been enough to get them over the hump, even if they’d just been below-average on offense. The issue: the Jazz crushed their half-court offense, and won the half-court battle 96-77. That’s a big deal, and it helped Utah pull this one off, in large part thanks to a fantastic fourth-quarter effort by Donovan Mitchell:

Mitchell was electric down the stretch, and it’s the most in-control he’s felt of an important game in some time. Everything ran through him, and with Bojan Bogdanovic being out the rest of the way, this seems like the obvious way most late-game Jazz possessions will go. It’ll be Mitchell taking the shot or attempting to create a wide-open one for someone else that he trusts. It’s more than a little funny we’re treating a third-year player as the wise old leader that knows best, but, well, here we are.

Mitchell wasn’t very good in the first three quarters of this game, though, and someone needed to pick up the scoring slack. Surprisingly, it was Jordan Clarkson catching fire off the bench, especially in the third quarter:

Clarkson got 23 points on 17 shots and may have been Utah’s third-best player in this one. Joe Ingles had a pretty middling game, committing five turnovers; Royce O’Neale rebounded well but had a rough night from three; Mike Conley scored 20 but struggled frequently on defense. It was up to Clarkson to deliver, and he did. Notably, Clarkson played as many minutes as the starters with 32; for a large portion of this game, the Jazz ran with a six-man rotation, and the only guys to get serious second-half playing time were Tony Bradley and Georges Niang, both out of necessity. We’ll have to monitor that going forward.

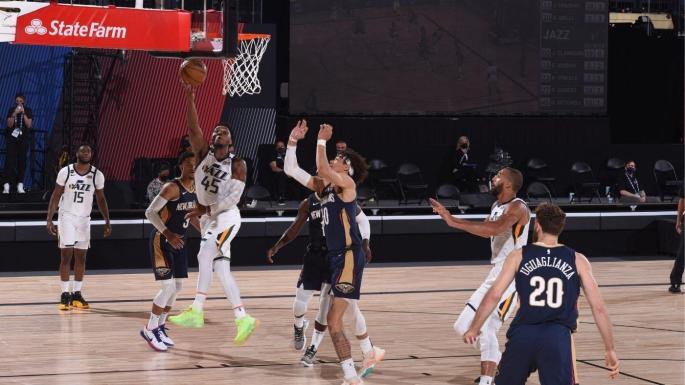
The last reason the Jazz won this game, and a very key one: Rudy Gobert.

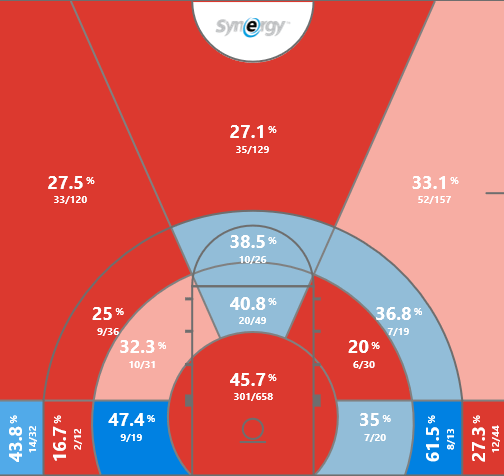
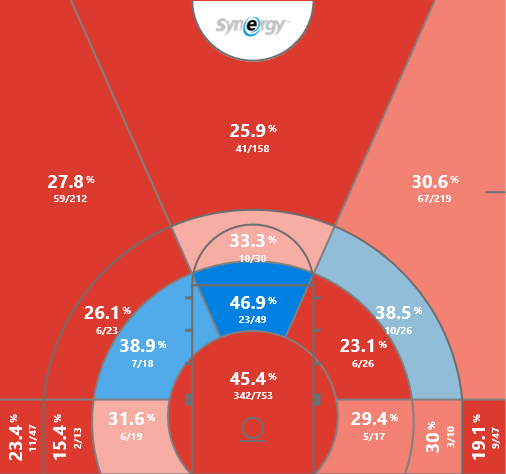
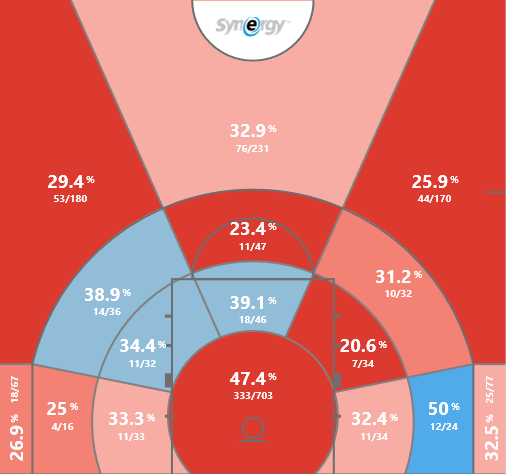
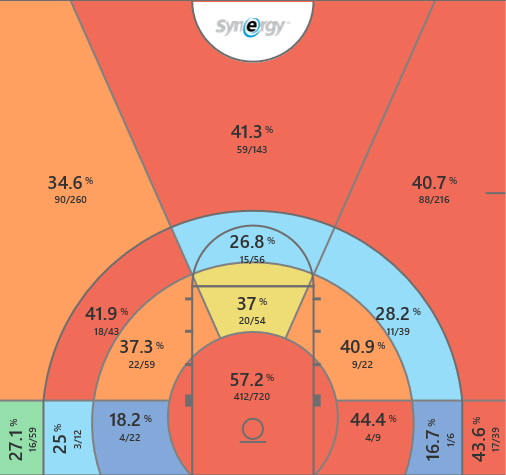
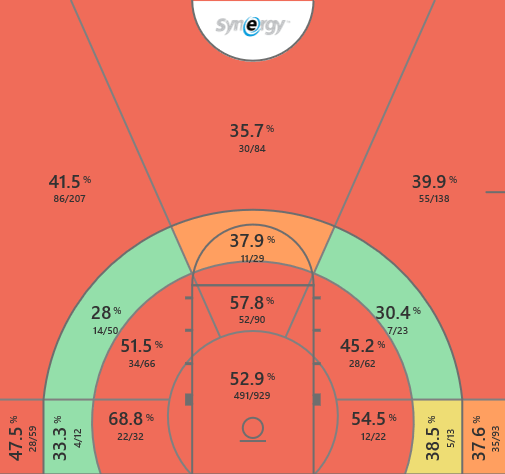
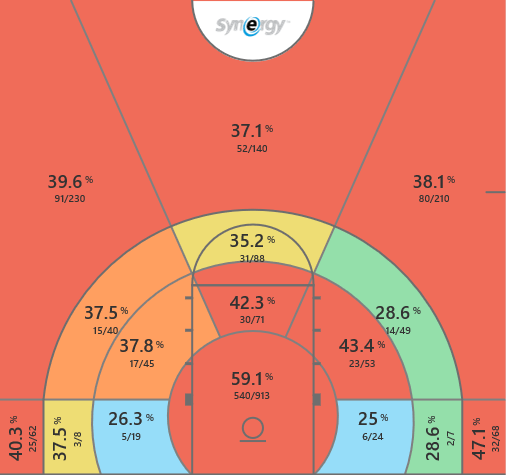
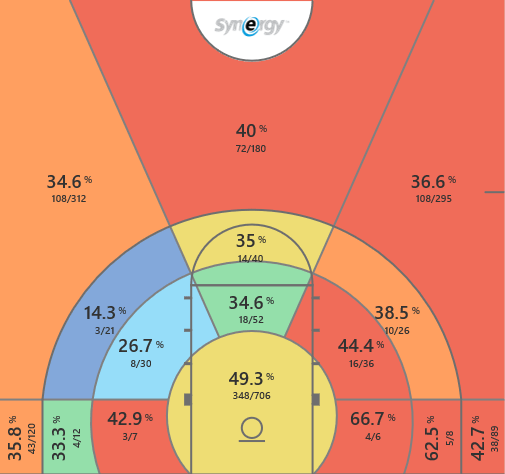
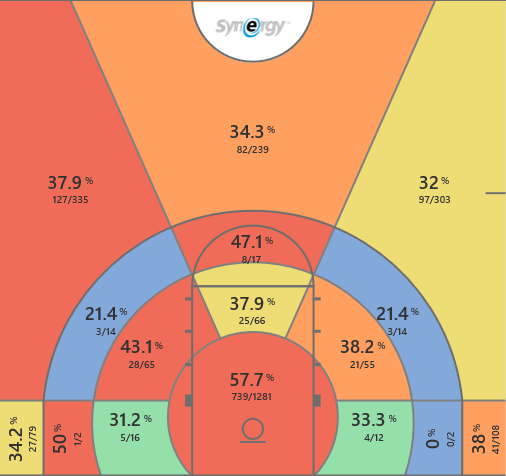
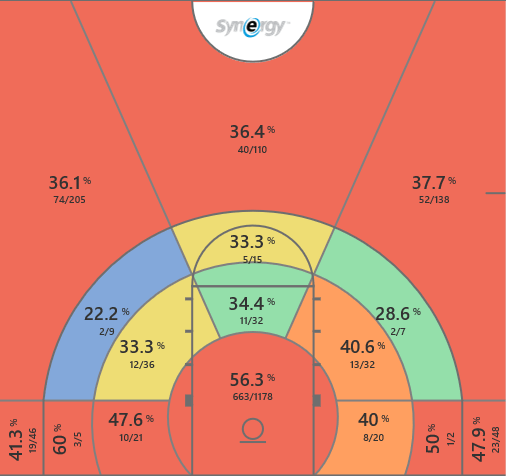
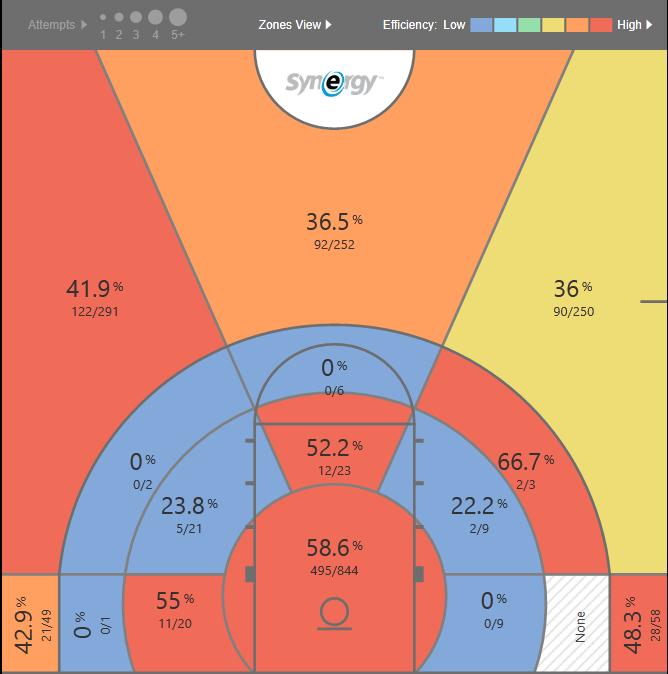
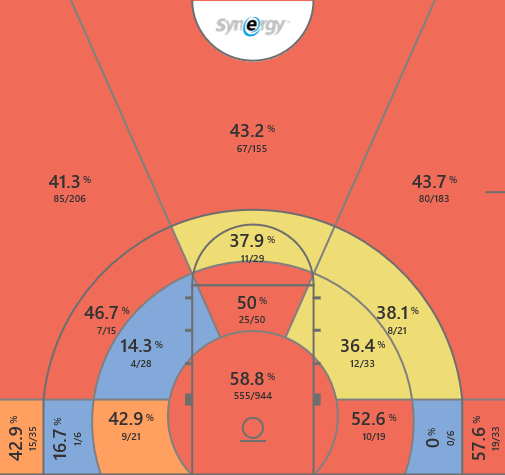
Some of this won’t show up in the stats, and some will, but it was Gobert who consistently saved Utah’s bacon throughout this game. Not only did he have a 10-point effort in the fourth quarter, he was Utah’s best rebounder defensively (unsurprisingly!) and came up with three blocks and a whole bunch of altered shots. If you’d like his impact spelled out, think of it this way: Utah, playing against a team without a true rim protector (Jaxson Hayes comes closest, but is too young and raw), converted 21 of 28 attempts at the rim. New Orleans, playing against Rudy Gobert for 34 minutes, converted 15 of 30. Breaking it down further, New Orleans converted 6 of 8 attempts at the rim during Gobert’s absence; they were just 9 of 22 when he played.

Other various pieces of discussion:

  • Neither team had fantastic shot selection, but it did feel as if Utah got the upper hand. 62 of their 84 field goal attempts were at the rim or from three; 61 of New Orleans’ 94 were. That said, New Orleans did hit 6 of their 15 long-range twos. If I were the Pelicans, I’d try to get a bit closer on those, and to be honest, there’s no reason J.J. Redick should be taking them when he could just take threes instead. (Brandon Ingram takes a lot of these, but he’s been pretty good at nailing them.)
  • Of real interest to me was that New Orleans did a bit better than anticipated on the boards, especially when Jaxson Hayes was in the game. Hayes picked up a crazy 5 OREBs in just 19 minutes of action and crushed the Utah frontcourt during his time out there. If Hayes can develop more of an offensive game to go with this particular skillset, he’ll have a long career, as he’s already become an above-average defender.

  • There’s something interesting to how badly New Orleans demolished Utah by in transition. The Jazz had one of the worst transition defenses in the NBA before the pandemic hit, ranking 27th in PPP allowed. The Pelicans aren’t a particularly efficient offense, but they got a lot of open looks against a Jazz D that struggled to properly get back. (Note the Redick three posted above.) I don’t know that the Pellies can do this against the Clippers in their next game, but they’ll have similar opportunities to push the pace to great success against Washington, San Antonio, and maybe Memphis.
  • Per stats.nba.com, the Pelicans’ pace when Zion was in the game was barely 90 possessions per 48 minutes…which is extremely slow for an offense that should be speeding things up whenever Zion is playing.
  • The Baby Death Lineup the Pelicans had struggled in this one, getting outscored 24-13 in 16 possessions due to missing some easy short-range looks and the Jazz targeting this lineup at the rim. The Jazz also hit 4 of 6 threes against it, which is difficult to repeat, but does highlight that this lineup isn’t infallible. That said, still easily the best thing the Pelicans have going.

The NBA is back. What’s the most interesting thing about each team?

After what feels like years in the wilderness, basketball is returning. It is coming up from the ground…belting out of every speaker…on every television, basketball is coming back. Okay, that’s a bit far, I’ll admit, but as a writer that mostly writes about basketball and its statistics, these last four months without it have been a bit tiring. I’ve missed my good friend, and I’m glad they’re back in town.

Below, there’s a ton of words about the NBA restart. The headline sums it up: what’s the most interesting thing about each team? This is not what’s the best player on each team, but rather: what’s the most interesting, unique, weird thing about each team? It helps if it’s statistically-based, which just about everything here is. I’ve included GIFs for each entry, all 22 of them, and I plan on writing deeper about all 22 teams at various points of the restart. For now, consider this a primer to a whole lot of content coming forward soon. Thanks for hanging with me, friends.

On this page are the 1-4 seeds as they stand in the Eastern Conference. To skip ahead, you can click below:

Eastern Conference

1. Milwaukee Bucks (53-12): Khris Middleton’s midrange game

While most of the attention deservedly goes to the best player in the NBA, Giannis Antetokounmpo, the second-best player on the Bucks has been one of the league’s 15 best players for a couple of years now. Khris Middleton plays a distinct second banana to the star Giannis, but the Bucks wouldn’t be the Bucks without him. This is maybe Middleton’s finest outing yet: a 21.1 PPG, 6.2 RPG season where he’s shooting 54.7% from two and 41.8% from three. Add that onto his well-deserved reputation as a stout defender, and you can understand the hype for a player who’d be the best player on over half the teams in the league.

What helps Middleton stand out? The fact that, at age 28, he’s quietly become a premier mid-range shooter in a league that’s moved away from the mid-range as a whole. Middleton is shooting an astounding 52.3% on mid-range attempts this season, second only to Chris Paul among players with at least three mid-range attempts per game. (The top five: Paul, Middleton, Malcolm Brogdon, C.J. McCollum, and D’Angelo Russell.) Like Paul, what stands out about Middleton is his capability of making them in nearly any situation. He’s made 31 of 52 fadeaway two-point attempts:

20 of 42 step-backs:

And 59 of 99 pull-up twos, many of them coming out of pick-and-roll sets like this one:

While Giannis is likely a guarantee to post 30 and 10 most nights in the bubble, the Bucks’ fortunes will swing based on how well Middleton can provide a reliable second option to Giannis. In losses this season, Middleton has made just 34.7% of his mid-range attempts and has posted 47.1% 2PT/37.1% 3PT shooting splits, versus 56.5% 2PT/43.7% 3PT in wins. For the Bucks to fulfill their work over the first five months of this season, it’s on Middleton to be the same top 15 player he’s been for two years now.

2. Toronto Raptors (46-18): How many corner threes can a team allow?

The Toronto Raptors have been one of the most pleasant surprises of the season. After Kawhi Leonard’s departure in free agency for Los Angeles, they had to try and make their roster still work in a somewhat-diminished Eastern Conference. At the beginning of the season, the East was largely thought to be a two-team race between Milwaukee and Philadelphia, with Boston and Toronto fighting it out for third/fourth. Milwaukee, Boston, and Toronto have held up their end of the bargain; Philadelphia hasn’t. It’s been because of Toronto’s great defense, ranking second-best by Defensive Rating because they force lots of turnovers and have done a great job making life difficult for opponents at the rim.

That said, they’ve got a really baffling thing going on with their three-point defense. No team has forced a lower opposing three-point percentage than Toronto, but no team has allowed a higher percentage of corner three-point attempts. At least with Milwaukee’s large amount of threes allowed, 80.3% of them have been from the wings or the point – less statistically advantageous shots on the whole. No team has come close to the Raps in terms of corner threes allowed; the distance from Toronto’s 30.9% of all three-point attempts to second-place Houston (25.6%) is nearly the same as the distance from Houston to 16th-place Orlando (20.2%).

This hasn’t borne itself out in terms of a win/loss split as much; opponents make 33.3% of their threes in Toronto’s wins versus 34.9% in losses. Still, there’s a huge opportunity available for good-shooting opponents. In particular, the Raps are 0-2 against current 4 seed Miami, who got tons of open looks in both games against Toronto:

I don’t see this affecting Toronto much in the first round, but the second – where the Raps could draw any of Boston (12th in 3PT%), Miami (1st), Indiana (13th), or Philadelphia (14th) – could be the first time a problem presents itself.

3. Boston Celtics (43-21): Robert Williams and his stocks

As a loose Weird Celtics Twitter follower – shoutout to the Riffs Man – I have become quite familiar with one Robert Williams, AKA Time Lord. Williams has been a bit player for the Celtics for a couple of years now, a guy who probably would’ve had a better career had he been born in 1987 and not 1997. (6’8″, 237 pound centers that can’t shoot past ten feet…well, they simply don’t fit the 2020 model.) Williams is fairly efficient the 10-15 minutes a game he sees the floor, but he commits six fouls per 100 possessions, makes a ton of avoidable mistakes, and can never stay on for very long.

It is with all those qualifiers that I have to note he’s the single most fascinating swing player on this roster to me. When Williams gets in the game, he’s been a defensive dynamo: 3 steals and 4.2 blocks per 100 possessions, a +4.4 Defensive Box-Plus Minus, the best steal rate for any frontcourt player in the league, and the third-best block rate among players getting 10+ minutes per game. It is really, really hard to find big guys that can do this:

And this:

Before the pandemic hit, Williams was getting anywhere from 10 to 16 minutes a game, and in his final four games, he committed six fouls in 54 minutes played. Far from ideal. BUT: he also blocked seven shots, got three steals, and frequently made plays that made you wonder why he doesn’t play more often.

Of all the players I could pick to be interested in, the Celtics’ 10th/11th man is certainly an odd choice. But he’s a really bizarre odd choice, isn’t he?

4. Miami Heat (41-24): Can Duncan Robinson’s threes make up for Duncan Robinson’s defense?

If you’ve known me for any length of time, you probably know that I lend my fan support to a pair of college basketball programs: Tennessee and Michigan. I graduated from Tennessee so that’s an obvious pick, but I also like Michigan because my dad went there and, to be honest, they were more interesting for most of my youth. Anyway, that’s a long way of saying that I watched probably 80% of Duncan Robinson’s games during his time at Michigan. He was a fantastic shooter, especially in spot-up situations, and was a very good bench player for the Wolverines. At no point during Duncan Robinson’s time at Michigan did I think he’d have any future in the NBA, much less a future as an NBA starter on one of the league’s best teams.

Well, here we are! Robinson started in 60 of Miami’s first 65 games, gets more minutes per game than everyone not named Bam Adebayo or Jimmy Butler, and has somehow became the most lethal spot-up shooter in the entire freaking league.

Robinson hits 44.8% of his threes on 8.4 attempts per game, which is crazy high. Only James Harden and Buddy Hield have made more threes this season, and Robinson’s attempted considerably fewer threes than both players. It’s unreal how great of a shooter he is, especially when every opponent knows he’s Miami’s main threat from downtown:

Robinson really does have a future in the NBA, regardless of if he can play on both sides of the ball. A slight issue with his immediate future: he isn’t a positive force yet on defense. Robinson’s -0.9 Defensive EPM ranks in the 30th percentile of the league, and Heat opponents have worked to get him in negative situations. Evan Fournier blows by Robinson pretty easily for a reverse layup here:

Robinson isn’t outrageously bad on defense, but opponents shoot 6.1% better than their normal average against him from two. He’s done a solid enough job sticking with guys on the perimeter, but it’ll be on Erik Spoelstra and the Heat to keep him out of matchups where he’s at an athletic disadvantage.

Let’s talk about “tiers” in college basketball

Recently, this graphic came to my attention:

I don’t really know the source of the image, but I assume it originated from a message board. Most of these things do. Anyway, I have some thoughts about it:

  1. Graphic design is clearly not this person’s passion. This thing looks like garbage – “All-Time” and “College Basketball Tiers” are not centered appropriately, black-on-gray almost always looks sad, and the team logos remind me of going to SportsLogos.com in 2005 to look at old logos.
  2. While some tiers are pretty good, others are…questionable. If you know much about college basketball history, it’s hard to question Tier 1 at all. Those five programs are the winningest in college basketball history, and no one else really comes all that close. As crazy as it sounds, the weakest selection is UCLA, a team that’s won more national titles than everyone else but has a lower WP% than anyone else in this group of five. But Tier 2, which features a Georgetown program with one appearance past the Sweet Sixteen since 1996, and UConn, a team with four titles but almost no pre-1990 success…that’s problematic.
  3. I think it’s probably accurate on the whole but could be tweaked to be better. Also, I’m bored and still in the house.

So, with that in mind and with little else to do after my day job ends at home, I set off to form a more perfect list, with tiers still in the mix. There’s a few different ways to fix this image, but on the whole, it’s a good start; this is more about tweaks than wholesale change. Here’s my theoretical fixes to this theoretical image.

  1. More thoroughly define the “tiers” of teams. We won’t change the “blue bloods” tier, because it’s basically flawless. However, “great” needs a better definition. Do “great” programs get there on the strength of continuous success? Do they get there because of title runs that mask periods of inadequacy? The same goes for “good” and “solid”, which are very close to being the same thing. Here’s my proposal: Tier 2 turns into Mostly Great, Tier 3 is Occasionally Great, Mostly Good, Tier 4 Solid and Reliable, and so on.
  2. Make separate lists for high-major and mid-major programs. The original image starts to hit a bit of a mess when it ranks these two separate classes with vastly different resources beside each other. For instance, Iowa and Penn rank alongside each other as Tier 4 programs all-time. At a very specific brand of face value, it makes sense; Iowa’s been to 26 NCAA Tournaments in its history, Penn 24. Here’s the issue: one of these teams plays a much harder schedule. Iowa ranks 13th all-time in Sports Reference’s Simple Rating System; Penn ranks 134th. We can’t realistically mash these two teams against each other unless it actually makes sense to do so. An important qualifier: Gonzaga will rank as a high-major in the last five and last ten years lists, as will every AAC team. While the AAC isn’t quite on the level of the Big Six typically, it’s close enough that they’re above being a mid-major conference. Gonzaga, meanwhile, is a new-era blue-blood.
  3. Make an additional list for the last five years. That way, we have an all-time list, Ken Pomeroy’s 23-year list, and a reading of how programs look to recruits in 2020-21. While UConn may rate out as the 19th-best program on Pomeroy’s list, it’s much harder to make that argument when narrowed to the last five years, when recruits have actually paid attention to college basketball. The average recruit for the 2021-22 season would’ve been about 13 years old in 2015, and it’s hard to expect a then-seventh grader to be following college basketball all that closely beyond a loose understanding of who’s been good in March.

Without further ado, here’s our All-Time, Last Five Years, and Last Ten Years lists.

All-Time College Basketball Tiers (Big Six + select MMs)

  • Tier 1: Blue Bloods. Same as the original – Kentucky, Duke, North Carolina, Kansas, and UCLA.
  • Tier 2: Mostly Great. These are teams that, for most of their history, have been yearly NCAA Tournament fixtures, finish in the AP Poll Top 25, and occasionally win a title. This tier contains ten teams: Indiana, Louisville, Michigan State, Villanova, Illinois, Cincinnati, Ohio State, Michigan, Syracuse, and Arizona. For the most part, these teams have routinely been March fixtures, making deep runs and winning a good amount of conference titles. Historically, Indiana has been closer to Tier 1 than Michigan State, but five years from now, that probably won’t be the case anymore. Cincinnati, of course, looks like a questionable pick. But think about it: in 24 of the last 29 years, they’ve made the NCAA Tournament. They’ve finished ranked in the AP Poll 15 times. They do own a pair of national titles in the early 1960s, and other than the 1980s, they’ve consistently won their conference or contended for it every year post-World War II. They’ve yet to go beyond the Elite Eight since 1992, but I’m not sure it really matters; they are basically always a threat.
  • Tier 3: Occasionally Great, Mostly Good. Teams that make the NCAA Tournament a good amount of the time and every now and then make deep runs, sometimes winning a title. However, their success is not as sustained as Tier 2, and there may be lengthy periods in their history where they were mediocre-to-bad. Along with this, their identity lies in consistently being good, not great. This is the largest tier, with 29 teams included: Purdue, Iowa, NC State, Notre Dame, Maryland, Oklahoma, Marquette, Wisconsin, Memphis, St. John’s, Tennessee, Kansas State, UNLV, Missouri, Oklahoma State, Utah, Florida, BYU, Arkansas, Providence, Alabama, West Virginia, Dayton, Gonzaga, Virginia, Georgetown, Temple, Connecticut, and Texas. (A reminder that these aren’t really in any specific order.) Collectively, these 28 teams own 12 of the national titles in the 35-year period of the 64/68-team field, which is a good chunk of the pie. However: those top five teams own the other 15. (Tier 2 has eight titles among its ten teams, or just under one per program.) The most controversial inclusion here will obviously be Connecticut, a team with four national championships since 1999. However: the program had two NCAA Tournament appearances between 1967 and 1990, didn’t make a Final Four until 1999, and has had lengthy periods in its history – one of which they’re currently in – where the program was irrelevant on a national scale.
  • Tier 4: Solid and Reliable. Rare is it that these programs are outright bad, but even rarer is it that they’re truly attention-grabbing. These programs largely have lived for being an 8 or 9 seed with the occasional Sweet Sixteen run. Seventeen teams are in this tier: Minnesota, Vanderbilt, Stanford, Florida State, USC, Washington, California, Iowa State, UAB, DePaul, Houston, Xavier, LSU, VCU, Pittsburgh, Western Kentucky, Saint Joseph’s, and Texas Tech. Remember that these are all-time, not recent; from 1976 to 1992, DePaul made 14 of 17 NCAA Tournaments and finished in the AP top 10 seven different times. If you’re 55 or older, you likely remember a time when DePaul was legitimately one of the six or so best college basketball programs. The flipside goes for VCU: they have a higher WP% than most of the teams in Tier 3 and some in Tier 2…but they’ve finished ranked in the AP Poll three times ever and the 2011 Final Four run is the only time they’ve advanced past the Round of 32. Likewise, Texas Tech had never advanced past the Sweet Sixteen until they hired Chris Beard. At one point in time, Western Kentucky was a yearly top 15 program or so…but the last time they were ranked period was 2001-02. They’re never bad, but they haven’t gotten anything above a 16 seed since 2009. We’re still giving them the honorary nod.
  • Tier 5: The Murky Middle. Odds are that these teams suffer from one of the following: a mediocre all-time record; not a ton of NCAA Tournament appearances; few deep March runs; few conference titles. They exist in a weird middle range where they’re not openly bad and not very good. Chances are that these teams have some good stretches in their past, and they’ve had flashes of greatness, but they aren’t often a consistent March fixture. Fourteen teams are in this tier: Oregon State, Oregon, Nebraska, Georgia Tech, Auburn, Clemson, Colorado, Tulsa, Arizona State, South Carolina, Mississippi State, New Mexico, Seton Hall, Georgia, and Virginia Tech. Some of these teams have made a Final Four recently, and Oregon and South Carolina even made it in the same year. That’s nice! It also doesn’t excuse the fact that South Carolina has just two NCAA Tournament appearances since 1998 or that Oregon went from 1961 to 1995 without a single March appearance. (Phil Knight cures all, it seems.) Oregon State has made just one NCAA Tournament appearance since 1990, but for serious stretches of time (1975-1990, mostly), they hung around the top of the Pac-8 (and then Pac-10) yearly. In true Oregon State fashion, their 1980-81 and 1981-82 teams went a combined 51-7 but failed to make the Final Four both times. They haven’t won a Tournament game since, and odds are their brief 2016 Tournament appearance is the first time anyone under 30 has ever thought about Oregon State basketball. Seton Hall barely got in here, because despite being thoroughly mediocre from roughly 1957 to 1987, they do own a national title game appearance and have made several March appearances over the last three decades. The last truly great team they had was in 1992-93, though.
  • Tier 6: Baylor. They don’t really fit anywhere else, to be honest. It’s really hard to neatly find a spot for a team with seven 20+ loss seasons, multiple 20+ year NCAA Tournament droughts, and also two Elite Eight runs and a team that likely would’ve gotten a third this year. Historically, their lows have been lower than just about anyone in Tier 5…but so have the highs. We’ll punt.
  • Tier 7: Don’t Buy or Sell, It’s Crap. For the most part, these programs have a mediocre history and have won little of serious substance. Sometimes, one of these teams will pop up out of nowhere en route to a 3 seed and a self-immolation in the Sweet Sixteen. Seven teams go here: Miami, Boston College, Washington State, Ole Miss, Texas A&M, Penn State, and TCU.
  • Tier 8: Despair. This is the lowest of the low. These teams, for the most part, have never experienced serious success, and just making the Tournament feels like a heroic feat. Never mind actually winning a game! I get sad thinking about these programs. Five teams stand out here: Rutgers, Northwestern, South Florida, Southern Mississippi, and Tulane. Northwestern did make the NCAA Tournament in 2017, and Rutgers was well on track to do it in 2020. That being said…both schools would’ve been rapturously excited to be an 8 or 9 seed, because it would’ve been Rutgers’ first visit in nearly 30 years and it was Northwestern’s first visit ever. South Florida, Southern Miss, and Tulane are three mid-major programs with three post-1984 NCAA Tournament runs each, and it really feels like all three programs should be better…but they just aren’t. South Florida has lost fewer than 10 games in a season once in 47 seasons, Southern Miss’ only sustained success in my lifetime was immediately undone by Donnie Tyndall’s NCAA troubles, and Tulane hasn’t touched double-digit conference wins since 1997.

Okay! That was fun. Let’s now move on to the Last Five Years lists. Below are the same tiers, but simplified to the last five years only. The first list is high-majors + AAC + Gonzaga; the second list is mid-majors only.

The Last Five Years of College Basketball Tiers (Big Six, AAC, and Gonzaga)

  • Tier 1: The New-Age Blue Bloods. Hey, remember when the first list had an easy, widely-agreed-upon definition of Blue Bloods? That doesn’t exist right now. New powerhouses have risen up to become the best programs in college basketball. There’s a new top five program list in college basketball: Virginia, Kansas, Duke, Villanova, and Gonzaga. Four of the last five national titles belong to this group, and the teams without a recent title (Kansas and Gonzaga) have made at least three Elite Eights from 2015 onward. The most controversial exclusion(s?) from this list are covered in Tier Two.
  • Tier 2: Mostly Great. Same criteria: for the most part, these squads have been yearly NCAA Tournament fixtures, with half of them making a Final Four run and seven of the ten owning at least one Elite Eight visit. These ten programs are Michigan State, Kentucky, Purdue, North Carolina, Michigan, Louisville, West Virginia, Baylor, Cincinnati, and Texas Tech. A quick rebuttal to those who would like MSU and Kentucky in Tier 1: while the argument could exist, it’s hard to back it up statistically. Michigan State did make the Final Four in 2015 and 2019, but their 2016-2018 performances – Round of 64, Round of 32, Round of 32 – don’t measure up with those of the top five. Kentucky, meanwhile, hasn’t been to a Final Four since the 38-1 team and has slowly started to lose the edge they’d built in recruiting for years. They’re the class of the SEC, but the SEC hasn’t been one of the three best Big Six conferences since 2006-07, per KenPom. The Big East, a non-football conference with a significantly smaller budget than the SEC, is a clearly superior conference. Then again, those schools generally don’t make coaching hires as bad as the SEC’s.
  • Tier 3: Occasionally Great, Mostly Good. Teams that make the NCAA Tournament a good amount of the time and every now and then make deep runs, sometimes winning a title. Along with this, their identity lies in consistently being good, not great – the average team in this group has had one, maybe two top-4 seeds, but on the whole, they’ve not typically been one of the 16 best teams in the field. In a couple of cases, a team has made a deep run in the Tournament but has had a few down years otherwise. Tough selections were made in this one. Included in this group: Florida State, Oregon, Florida, Maryland, Xavier, Wisconsin, Houston, Wichita State, Creighton, Butler, Arizona, Seton Hall, Oklahoma, Tennessee, Kansas State, Ohio State, and Auburn. The toughest selections were on both ends here: Florida State would have made it four straight NCAA Tournament bids this year, with three of those being top-4 seeds. They had a solid case for the Mostly Great tier. However: they haven’t topped 14th in KenPom in any of these seasons, and they started this parameter of time by missing the Tournament. They’re more good than great. Auburn, meanwhile, went 12-24 in SEC play over the first two years of our search. Objectively, they were bad, and it would’ve taken something heroic to even get them to touch this tier. The Final Four run in 2019 is just enough to push them into Tier 3; their 25-6 record this season belied them being the seventh-luckiest team in all of CBB. (Their “real” record would’ve translated to something like 22-9 and about 10-8…meaning with a less-unusual run of wins in coin-flip games, they could’ve been the sixth-best team in their own conference.)
  • Tier 4: Solid and Reliable. Rare is it that these programs are outright bad, but even rarer is it that they’re truly attention-grabbing. These programs largely have lived for being an 8 or 9 seed with the occasional Sweet Sixteen run. This tied for the largest group at 20 teams deep: Kansas State, Marquette, Miami (FL), Virginia Tech, Indiana, Clemson, Texas, Notre Dame, Iowa, Syracuse, Providence, TCU, Arkansas, SMU, UCLA, Texas A&M, Oklahoma State, USC, and LSU. None of the top-end teams were serious threats to enter Tier 3, but LSU was a real threat to fall to Tier 5. They would’ve made the NCAA Tournament this year as an 8 or 9 seed, which would be fine…but their first three years of this run resulted in zero NCAAT runs and a 21-33 SEC record. Will Wade is a fantastic coach that will almost certainly get fired for something other than coaching, so I think they’ve done enough to rise into Tier 4. The team that statistically should be here but isn’t is South Carolina. The Gamecocks are a strange case: in the five years of this search, they never went worse than 7-11 in conference and did make the famous Final Four run in 2017. However: that’s their only NCAA Tournament run under Frank Martin, and it’s the only time they’ve ranked higher than 58th in KenPom under him. LSU has two seasons that are better, and even though their lows were much lower than South Carolina’s, they got the nod. South Carolina is solid and reliable, but not in terms of actually being a good Big Six program. One last note: SMU is the only mid-major in this tier, and it sounds ridiculous when you see their last three KenPom finishes: 84th, 107th, 88th. The first two years are what got them here: 16th in their tournament-banned 2015-16 (likely would’ve been a 5 or 6 seed) and 11th in 2016-17.
  • Tier 5: The Murky Middle. Odds are that these teams suffer from one of the following: a mediocre record; few NCAA Tournament appearances; fewer deep March runs; no conference titles. They exist in a weird middle range where they’re not openly bad and not very good. Like Tier 4, this group is 20 teams strong: South Carolina, NC State, Penn State, Alabama, Utah, Mississippi State, Minnesota, Colorado, Arizona State, Georgia, Northwestern, Ole Miss, Georgetown, Georgia Tech, Illinois, Temple, Memphis, UConn, UCF, and Tulsa. A lot of AAC teams slid in at the end. They haven’t ranked as well on KenPom/Torvik, but their overall records were enough to get them in here as opposed to Tier 6. In particular, Tulsa and UConn were problematic cases: both have only been to one NCAA Tournament in the last six years, and neither would’ve made this year’s field. That said, Tulsa did post three 12+ win seasons in the AAC in our search and UConn had four Top 100 finishes. Outside of Tulsa’s 2016-17 and UConn’s 2017-18, neither has really had a truly forgettable season. I’ll allow it.
  • Tier 6: Don’t Buy or Sell, It’s Crap. Generally, this group has few wins of substance and has made no real noise in March. A few of these programs could reasonably be in Tier 5 but didn’t make it for various reasons: a season that tanked their overall stock, a lack of NCAA Tournament runs, or never doing particularly well in conference play. Eleven programs stand in Tier 6: Washington, Nebraska, Vanderbilt, Stanford, Pittsburgh, Wake Forest, St. John’s (NY), Missouri, Oregon State, Rutgers, and California. Quick: do you remember that Cal actually started this five-year search by being a 4 seed in the NCAA Tournament? Also, do you remember that it ended with a double-digit loss to a 13 seed? That’s the kind of stuff we’re looking at. Washington, in particular, had a good case for Tier 5: they’re objectively better at basketball than probably five of the teams up there. However, their awful 2016-17 season tanked their stock, and the fact they haven’t topped 48th in KenPom since 2010-11 really puts a limiting ceiling on how high they can go. They should break into Tier 5 with another top 60ish season in 2020-21; Torvik projects them 42nd. Among this tier, only Stanford (23rd!) and Rutgers (31st) project higher.
  • Tier 7: Despair. Making the Tournament would be a heroic feat for these programs. “Success” is not sustained at all, and is best represented by the occasional .500 record in conference play. Only six teams fell to Tier 7: DePaul, Boston College, Washington State, South Florida, Tulane, and East Carolina. None were serious contenders for Tier 6, and you could easily make the argument that the bottom three teams here are closer to a Tier 8 than a Tier 6. For now, they’re together. South Florida’s 2012 NCAA Tournament bid is the only NCAAT bid this decade among these six programs.

Lots of words! Now, the mid-majors.

The Last Five Years of College Basketball Tiers (Mid-Majors Only)

A quick reminder: Gonzaga cannot really be considered a mid-major anymore; they routinely post top 10 recruiting classes and have poured a ton of money into basketball. In fact, Gonzaga puts more money into their basketball program than half of the Big Six programs. They’re a high-major now. As such: this list includes everyone other than Gonzaga and the AAC.

  • Tier 1: The Mid-Major Blue Bloods. Every year, you can trust these teams to be right at the top of their conference. They’re a yearly NCAA Tournament fixture, and it’s expected for them to make some March noise. These are teams that have routinely graduated from the 13-16 seed treadmill. This group is five teams deep: Saint Mary’s, Dayton, San Diego State, Nevada, New Mexico State, and VCU. Every year, you expect to see these teams in March. While Dayton and San Diego State’s stars are inflated a bit by unusually great 2019-20 seasons, they’re still March regulars and have histories of legitimate success. New Mexico State is the toughest case. They have fewer losses than any other mid-major not named Gonzaga, and a 2019-20 bid would’ve represented their eight NCAA Tournament run in nine years. Despite them not winning a single game in any of those runs, they still get in by virtue of pure dominance of their conference. They’re 80-8 in the WAC since 2014-15. VCU got a real ‘benefit of the doubt’ nod here; they went 8-10 in the A-10 this year and ranked 144th in 2017-18, but all of their six NCAA Tournament bids from 2012-13 onward have been as a 10 seed or higher.
  • Tier 2: The 12-14 Seeds. Tough one to work on here. Some of these teams are more like 11 seeds when they make the Tournament, but they’re not consistent-enough fixtures to be in Tier 1. Generally, these teams are either consistently great in lower-tier conferences or consistently good in the upper echelon (A-10, MWC, WCC) of mid-major land. Not all of these teams make the Tournament every year, but out of this batch of names, you can expect to see several in your bracket yearly. Tough cuts were made here, but we still ended up with 23 teams: BYU, Rhode Island, Belmont, Vermont, Davidson, East Tennessee State, Buffalo, Yale, St. Bonaventure, Boise State, South Dakota State, Utah State, UNC Greensboro, Furman, UC Irvine, Loyola-Chicago, College of Charleston, Stephen F. Austin, Hofstra, Princeton, Akron, Murray State, and Old Dominion. This group was always going to be huge, simply because there’s a much bigger pool of teams to pick from. Belmont and Vermont had the best Tier 1 cases, as both are yearly March fixtures and routinely win their conference…but neither have the March wins to be a blue blood. It is what it is.
  • Tier 3: Good-Not-Greats. Wide swath here: maybe these are teams that are always the fourth-best team in the A-10. Maybe they’re pretty good in a weak conference. Maybe they’re just good in an average conference. Either way, there’s a lot of ’em. I think there’s 41 teams here: Fresno State, San Francisco, Winthrop, Northern Iowa, Harvard, Grand Canyon, Wright State, Montana, Louisiana Tech, Georgia State, UT-Arlington, Northern Kentucky, Wofford, Middle Tennessee, Western Kentucky, Valparaiso, UAB, Illinois State, Penn, Richmond, Southern Illinois, Toledo, Kent State, William & Mary, Liberty, Louisiana-Lafayette, Stony Brook, Northeastern, Marshall, Bucknell, North Dakota State, Hawaii, UC Santa Barbara, Monmouth, Eastern Washington, Lipscomb, Ball State, Oakland, Iona, Texas Southern, Texas State, and Merrimack. Exhaustingly long! Texas State barely slid in at the end – they’re 87-69, but have a pair of sub-.500 finishes in the Sun Belt. Still: three 20+ win seasons speak for themselves, and they should be pretty good again in 2020-21. Merrimack has all of one season of D-1 play to their name, but it was so good that I almost felt required to get them in at Tier 3.
  • Tier 4: “Fine.” Occasionally, one of these teams will have a great season and pop up in your bracket as a 13 seed, but for the most part, they operate outside of the NCAA Tournament. Nothing wrong with that! Generally, you can expect these teams to be consistently solid, and their range of outcomes are pretty easy to nail down. Lots of teams in this one, again: New Mexico, Saint Louis, UNLV, Georgia Southern, South Dakota, Radford, Ohio, Colorado State, George Mason, Cal State Bakersfield, North Florida, Chattanooga, Saint Joseph’s, Chattanooga, Duquesne, Sam Houston State, Weber State, Austin Peay, Bowling Green, Central Michigan, Florida Gulf Coast, Green Bay, Rider, Northern Colorado, Colgate, Towson, Lehigh, Albany, St. Francis (PA), Jacksonville State, Boston University, North Carolina Central, Siena.
  • Tier 5: The Somewhat Murky Middle. These are more on the side of lower-tier A-10/WCC/MWC teams, mid-pack SoCon teams, and higher-end Southland squads. The list: Eastern Michigan, Nebraska-Omaha, Utah Valley, George Washington, Santa Clara, Loyola Marymount, Indiana State, Missouri State, Tennessee State, UNC Wilmington, Gardner-Webb, Abilene Christian, Northern Illinois, IPFW, UNC Asheville, Long Beach State, Seattle, Brown, Drake, Mercer, Texas A&M Corpus Christi, Coastal Carolina, UC Davis, Nicholls State, North Dakota, North Texas, Wagner, UMBC, Portland State, Wyoming, Norfolk State, Navy, Hampton, Saint Peter’s, and Canisius.
  • Tier 6: Below-Average-ish. Sometimes, these teams make the NCAA Tournament, but generally, they aren’t very good. A couple of the teams in this grouping actually have conference titles to their name, but play in a bottom-three conference. Teams like: San Diego, Pacific, Evansville, Little Rock, La Salle, UMass, Pepperdine, Cal State Fullerton, South Alabama, Louisiana Monroe, Lamar, NJIT, Arkansas State, Oral Roberts, New Orleans, High Point, Western Michigan, Morehead State, Prairie View A&M, Elon, UTEP, Delaware, Eastern Illinois, Fairfield, Tennessee-Martin, Campbell, Montana State, FIU, LIU Brooklyn, Fairleigh Dickinson, Army, Idaho, Robert Morris, Southern, Hartford, Illinois-Chicago, Mount St. Mary’s, and Sacred Heart.
  • Tier 7: Forgettable Squads. To be honest, I spend months, even years without remembering the existence of these squads. They’re not truly the lowest of the low, but seasons with serious success are very rare. UMKC, Columbia, Western Carolina, Air Force, Cornell, Miami (OH), UTSA, Eastern Kentucky, New Hampshire, Southern Miss, Rice, Troy, Tennessee Tech, Florida Atlantic, Charlotte, Fordham, UT Rio Grande Valley, Samford, Southeastern Louisiana, Denver, Charleston Southern, Jacksonville, Appalachian State, IUPUI, Alcorn State, Milwaukee, Grambling State, Sacramento State, Dartmouth, Jackson State, Bethune-Cookman, James Madison, UMass Lowell, North Carolina A&T, Quinnipiac, American, Manhattan, Morgan State, and Loyola (MD). 
  • Tier 8: Basement. I feel bad, because no one should be given this designation; any of these teams can make the NCAA Tournament with a bit of March luck. That said, luck doesn’t seem very realistic for many of them. Dartmouth, Houston Baptist, Northwestern State, North Alabama, Western Illinois, Central Arkansas, Youngstown State, Cal State Northridge, McNeese State, Detroit, Portland, Idaho State, Incarnate Word, Drexel, UC Riverside, Holy Cross, South Carolina State, Southern Utah, Lafayette, Niagara, Citadel, St. Francis (NY), San Jose State, Cleveland State, Stetson, Cal Poly, Southeast Missouri State, Presbyterian, VMI, Kennesaw State, Binghamton, Alabama State, Florida A&M, USC Upstate, Northern Arizona, Bryant, SIU Edwardsville, Longwood, Arkansas Pine Bluff, Coppin State, Maryland Eastern Shore, Howard, Marist, Central Connecticut, Maine, Chicago State, Alabama A&M, Mississippi Valley State, and Delaware State. Apologies to all programs involved.

Hopefully, this gives us a better picture of both a long-term and short-term view of college basketball. If you were to extend the range to ten years for your search, I think it could produce somewhat different results, but you’re also theorizing that a current 18-year-old recruit was intently watching college basketball at 8-12 years old. (As someone who has loved basketball for most of my life, I didn’t start watching college basketball beyond occasional March games until age 10, and even that felt advanced.) This should provide a better, more reasonable view of how things look to the current recruiting class.

The best defenses in men’s college basketball, 2019-20

I promised this post nearly two months ago and got lost in some other projects, namely my beloved Program Reviews project that’s going to take a break for a little bit after this week. However, I couldn’t ignore the other, arguably more important half of basketball. Having an excellent defense is just about a requirement for any team to win a championship, and it especially goes that way in basketball. While offense has been more important by a hair, no defense ranked outside of the top 40 nationally has won the Division I national championship in the KenPom era. Similar numbers are likely true for D-2, D-3, and NAIA.

The below 25 defenses were ranked as the top 25 in America by Synergy Sports. If you go to their site, it won’t appear that way, as Canada has North America in a stranglehold in terms of high-quality defense. (The US wins out with ease on the offensive side, obviously.) Teams without enough games on the database were also eliminated, though those were rarer cases. In the end, these 25 defenses are all worthy of strong respect, and coaches would do well to study the teams of their choice. I wrote about Randolph-Macon’s defense earlier this season, but will likely write about other teams later this offseason.

Anyway, here’s the best men’s college basketball defenses of the 2019-20 season.

25. Liberty Flames (Lynchburg, VA)

  • Points Per Possession: 0.792
  • Best Play Types (90th-percentile or higher): Post Up (97th), Spot-Up (95th)
  • Percentage of Shots Attempted: 35.1% Rim (4 feet or closer to the rim), 25.6% Non-Rim Twos (5-20ish feet), 39.2% Threes
  • Shots Made by Category: 55% Rim, 30.8% Non-Rim Twos, 29.3% 3PT
  • eFG%: 45.6%
  • OREB% allowed: 21.3%
  • TO%: 19.4%
  • Shot Volume: 101.9

24. Winston-Salem State Rams (Winston-Salem, NC)

  • Points Per Possession: 0.792
  • Best Play Types (90th-percentile or higher): P&R Ball Handler (97th-percentile), Post-Up (97th), Spot-Up (96th)
  • Percentage of Shots Attempted: 38.9% Rim, 26.5% Non-Rim Twos, 34.6% Threes
  • Shots Made by Category: 49.4% Rim, 32.7% Non-Rim Twos, 30.3% 3PT
  • eFG%: 45.4%
  • OREB% allowed: 28.5%
  • TO%: 18.9%
  • Shot Volume: 109.6

23. Roanoke Maroons (Roanoke, VA)

  • Points Per Possession: 0.791
  • Best Play Types (90th-percentile or higher): Spot-Up (98th), P&R Ball Handler (98th), Post-Up (90th)
  • Percentage of Shots Attempted: 34.6% Rim, 25.7% Non-Rim Twos, 39.7% Threes
  • Shots Made by Category: 49.7% Rim, 32.6% Non-Rim Twos, 30.5% 3PT
  • eFG%: 44.5%
  • OREB% allowed: 27.3%
  • TO%: 20%
  • Shot Volume: 107.3

22. Stanford Cardinal (Palo Alto, CA)

  • Points Per Possession: 0.791
  • Best Play Types (90th-percentile or higher): Post-Up (99th), Spot-Up (96th)
  • Percentage of Shots Attempted: 36.6% Rim, 26% Non-Rim Twos, 37.4% Threes
  • Shots Made by Category: 52.6% Rim, 37.4% Non-Rim Twos, 29.5% 3PT
  • eFG%: 45.6%
  • OREB% allowed: 27.8%
  • TO%: 22.4%
  • Shot Volume: 105.4

21. Virginia Wesleyan Marlins (Norfolk, VA)

  • Points Per Possession: 0.791
  • Best Play Types (90th-percentile or higher): Spot-Up (97th)
  • Percentage of Shots Attempted: 48.2% Rim, 22.9% Non-Rim Twos, 28.9% Threes
  • Shots Made by Category: 49.3% Rim, 32.3% Non-Rim Twos, 29.6% 3PT
  • eFG%: 44.7%
  • OREB% allowed: 26.7%
  • TO%: 21.1%
  • Shot Volume: 105.6

20. West Virginia Mountaineers (Morgantown, WV)

  • Points Per Possession: 0.791
  • Best Play Types (90th-percentile or higher): Transition (97th)
  • Percentage of Shots Attempted: 36.3% Rim, 26.2% Non-Rim Twos, 37.5% Threes
  • Shots Made by Category: 54% Rim, 33% Non-Rim Twos, 28.8% 3PT
  • eFG%: 44.5%
  • OREB% allowed: 27.7%
  • TO%: 22.4%
  • Shot Volume: 105.3

19. Brockport Golden Eagles (Brockport, NY)

  • Points Per Possession: 0.789
  • Best Play Types (90th-percentile or higher): Transition (99th), P&R Ball Handler (96th)
  • Percentage of Shots Attempted: 43.3% Rim, 22.4% Non-Rim Twos, 34.3% Threes
  • Shots Made by Category: 51.9% Rim, 36.5% Non-Rim Twos, 29.4% 3PT
  • eFG%: 46.4%
  • OREB% allowed: 29.1%
  • TO%: 23.9%
  • Shot Volume: 105.2

18. Hobart College Statesmen (Geneva, NY)

  • Points Per Possession: 0.789
  • Best Play Types (90th-percentile or higher): Transition (99th), Cuts (98th), Spot-Up (94th)
  • Percentage of Shots Attempted: 34.7% Rim, 24.3% Non-Rim Twos, 41% Threes
  • Shots Made by Category: 49.7% Rim, 32.6% Non-Rim Twos, 27.4% 3PT
  • eFG%: 42.3%
  • OREB% allowed: 22.4%
  • TO%: 16%
  • Shot Volume: 106.4

17. San Diego State Aztecs (San Diego, CA)

  • Points Per Possession: 0.789
  • Best Play Types (90th-percentile or higher): P&R Ball Handler (97th), Spot-Up (95th)
  • Percentage of Shots Attempted: 25.6% Rim, 32.3% Non-Rim Twos, 42.1% Threes
  • Shots Made by Category: 61.1% Rim, 32.5% Non-Rim Twos, 29.7% 3PT
  • eFG%: 45.3%
  • OREB% allowed: 25.4%
  • TO%: 21.2%
  • Shot Volume: 104.2

16. Maine Farmington Beavers (Farmington, ME)

  • Points Per Possession: 0.786
  • Best Play Types (90th-percentile or higher): Transition (100th), Cuts (100th)
  • Percentage of Shots Attempted: 31.1% Rim, 25.5% Non-Rim Twos, 43.4% Threes
  • Shots Made by Category: 54% Rim, 32.8% Non-Rim Twos, 33.8% 3PT
  • eFG%: 48.5%
  • OREB% allowed: 23.5%
  • TO%: 23.5%
  • Shot Volume: 100.0

15. Rensselaer Polytechnic Institute Engineers (Troy, NY)

  • Points Per Possession: 0.785
  • Best Play Types (90th-percentile or higher): Spot-Up (96th)
  • Percentage of Shots Attempted: 35.8% Rim, 23.4% Non-Rim Twos, 40.8% Threes
  • Shots Made by Category: 59.5% Rim, 34.3% Non-Rim Twos, 29.3% Threes
  • eFG%: 47.6%
  • OREB% allowed: 23%
  • TO%: 23.7%
  • Shot Volume: 99.3

14. Stevens Ducks (Hoboken, NJ)

  • Points Per Possession: 0.784
  • Best Play Types (90th-percentile or higher): Spot-Up (97th), Off Screen (96th)
  • Percentage of Shots Attempted: 36.3% Rim, 23.6% Non-Rim Twos, 40.1% Threes
  • Shots Made by Category: 51.8% Rim, 33.8% Non-Rim Twos, 29.8% 3PT
  • eFG%: 45%
  • OREB% allowed: 25.4%
  • TO%: 22%
  • Shot Volume: 103.4

13. Christopher Newport Captains (Newport News, VA)

  • Points Per Possession: 0.783
  • Best Play Types (90th-percentile or higher): Spot-Up (99th), Post Up (94th)
  • Percentage of Shots Attempted: 36.9% Rim, 31.5% Non-Rim Twos, 31.6% Threes
  • Shots Made by Category: 49.6% Rim, 36% Non-Rim Twos, 28.1% 3PT
  • eFG%: 43.1%
  • OREB% allowed: 26.4%
  • TO%: 18.3%
  • Shot Volume: 108.1

12. Park University Pirates (Parkville, MO)

  • Points Per Possession: 0.783
  • Best Play Types (90th-percentile or higher): Spot-Up (97th), Transition (95th), Cuts (93rd)
  • Percentage of Shots Attempted: 42.4% Rim, 19.1% Non-Rim Twos, 38.5% Threes
  • Shots Made by Category: 53% Rim, 33.7% Non-Rim Twos, 28.6% 3PT
  • eFG%: 47.5%
  • OREB% allowed: 24.8%
  • TO%: 21.1%
  • Shot Volume: 103.7

11. UMass Boston Beacons (Boston, MA)

  • Points Per Possession: 0.783
  • Best Play Types (90th-percentile or higher): P&R Ball Handler (98th), Cuts (96th), Transition (90th)
  • Percentage of Shots Attempted: 41% Rim, 28.1% Non-Rim Twos, 30.9% Threes
  • Shots Made by Category: 49.1% Rim, 35.2% Non-Rim Twos, 30.1% 3PT
  • eFG%: 43.8%
  • OREB% allowed: 30.1%
  • TO%: 18.9%
  • Shot Volume: 111.2

10. Lincoln Memorial Railsplitters (Harrogate, TN)

  • Points Per Possession: 0.781
  • Best Play Types (90th-percentile or higher): Transition (99th), P&R Ball Handler (95th), Post-Up (94th), Spot-Up (93rd)
  • Percentage of Shots Attempted: 30.5% Rim, 29.4% Non-Rim Twos, 40.1% Threes
  • Shots Made by Category: 49.8% Rim, 37.6% Non-Rim Twos, 30.2% 3PT
  • eFG%: 42.7%
  • OREB% allowed: 23.3%
  • TO%: 18.7%
  • Shot Volume: 104.6

9. Indiana (PA) Crimson Hawks (Indiana, PA)

  • Points Per Possession: 0.78
  • Best Play Types (90th-percentile or higher): Cuts (98th), P&R Ball Handler (97th), Spot-Up (95th), Transition (90th)
  • Percentage of Shots Attempted: 39.4% Rim, 24.9% Non-Rim Twos, 35.7% Threes
  • Shots Made by Category: 52.3% Rim, 30% Non-Rim Twos, 30% 3PT
  • eFG%: 44.5%
  • OREB% allowed: 31.1%
  • TO%: 22.6%
  • Shot Volume: 108.5

8. Baylor Bears (Waco, TX)

  • Points Per Possession: 0.777
  • Best Play Types (90th-percentile or higher): Isolation (95th), Transition (93rd)
  • Percentage of Shots Attempted: 26.8% Rim, 38.2% Non-Rim Twos, 35% Threes
  • Shots Made by Category: 60% Rim, 33.5% Non-Rim Twos, 31.1% 3PT
  • eFG%: 45.2%
  • OREB% allowed: 29.8%
  • TO%: 22.7%
  • Shot Volume: 107.1

7. Kansas Jayhawks (Lawrence, KS)

  • Points Per Possession: 0.775
  • Best Play Types (90th-percentile or higher): P&R Ball Handler (96th), Post-Up (95th)
  • Percentage of Shots Attempted: 29.1% Rim, 29.5% Non-Rim Twos, 41.3% Threes
  • Shots Made by Category: 52% Rim, 33.6% Non-Rim Twos, 30.5% 3PT
  • eFG%: 43.7%
  • OREB% allowed: 26.4%
  • TO%: 18.6%
  • Shot Volume: 107.8

6. Baruch Bearcats (New York, NY)

  • Points Per Possession: 0.773
  • Best Play Types (90th-percentile or higher): Spot-Up (99th), Post Up (94th)
  • Percentage of Shots Attempted: 35.3% Rim, 25.1% Non-Rim Twos, 39.6% Threes
  • Shots Made by Category: 52.9% Rim, 27.4% Non-Rim Twos, 30.9% 3PT
  • eFG%: 43.6%
  • OREB% allowed: 27.7%
  • TO%: 22.1%
  • Shot Volume: 105.6

5. Virginia Cavaliers (Charlottesville, VA)

  • Points Per Possession: 0.763
  • Best Play Types (90th-percentile or higher): Spot-Up (98th), Post Up (95th)
  • Percentage of Shots Attempted: 30.5% Rim, 26.8% Non-Rim Twos, 42.7% Threes
  • Shots Made by Category: 48.7% Rim, 35.6% Non-Rim Twos, 29.2% 3PT
  • eFG%: 43.1%
  • OREB% allowed: 23.3%
  • TO%: 19.3%
  • Shot Volume: 104.0

4. Miles Golden Bears (Fairfield, AL)

  • Points Per Possession: 0.754
  • Best Play Types (90th-percentile or higher): Spot-Up (100th), Transition (100th), Post-Up (93rd), P&R Ball Handler (90th)
  • Percentage of Shots Attempted: 32.2% Rim, 35.5% Non-Rim Twos, 32.3% Threes
  • Shots Made by Category: 52.6% Rim, 32.7% Non-Rim Twos, 26.6% 3PT
  • eFG%: 42.3%
  • OREB% allowed: 26.8%
  • TO%: 18.9%
  • Shot Volume: 107.9

3. Memphis Tigers (Memphis, TN)

  • Points Per Possession: 0.752
  • Best Play Types (90th-percentile or higher): Cuts (100th), Spot-Up (97th), Transition (97th)
  • Percentage of Shots Attempted: 36.3% Rim, 27.2% Non-Rim Twos, 36.5% Threes
  • Shots Made by Category: 45.3% Rim, 34.6% Non-Rim Twos, 28% 3PT
  • eFG%: 41.2%
  • OREB% allowed: 29.4%
  • TO%: 20.2%
  • Shot Volume: 109.2

2. Shawnee State Bears (Portsmouth, OH)

  • Points Per Possession: 0.749
  • Best Play Types (90th-percentile or higher): They were 85th-percentile or higher in all but one category (Hand-Off); 90th-percentile or higher in everything but Spot-Ups and Hand-Offs.
  • Percentage of Shots Attempted: 32.9% Rim, 30.4% Non-Rim Twos, 36.7% Threes
  • Shots Made by Category: 40.4% Rim, 30.7% Non-Rim Twos, 33.5% 3PT
  • eFG%: 40.9%
  • OREB% allowed: 25.2%
  • TO%: 19.5%
  • Shot Volume: 105.7

1. Randolph-Macon Yellow Jackets (Ashland, VA)

  • Points Per Possession: 0.74
  • Best Play Types (90th-percentile or higher): Spot-Up (99th), Transition (96th), P&R Ball Handler (95th), Cuts (92nd)
  • Percentage of Shots Attempted: 33.3% Rim, 27% Non-Rim Twos, 39.7% Threes
  • Shots Made by Category: 50.6% Rim, 31% Non-Rim Twos, 29.6% 3PT
  • eFG%: 43.7%
  • OREB% allowed: 26.3%
  • TO%: 23.7%
  • Shot Volume: 102.6

The best offenses in women’s college basketball, 2019-20

This is the same basic idea as my post on the 25 best offenses in men’s college basketball, but just using the Synergy Sports numbers. I didn’t have as much time as I’d like to knock this one out, and I’d like to move on to profiling defenses later this week before spending another two days on offensive success.

Below is each team’s shot chart, their best play types, shooting splits, and tempo, which is calculated via Ken Pomeroy’s equation listed here.

25. Hawaii Pacific Sharks (Honolulu, HI): 0.936 PPP

  • Best Play Types (90th-percentile or higher): Off-Screen (99th-percentile); Transition (94th)
  • Percentage of Shots Attempted: 36.6% Rim, 23.2% Non-Rim Twos, 40.2% Threes
  • Shots Made by Category: 55.4% Rim, 35.7% Non-Rim Twos, 36% 3PT
  • Tempo: 75.34 possessions (would rank #7 of 353 among D-1 men’s offenses, per KenPom)

24. Drake Bulldogs (Des Moines, IA): 0.936 PPP

  • Best Play Types (90th-percentile or higher): Cuts (99th), Post-Up (97th), Off-Screen (97th), Spot-Up (91st)
  • Percentage of Shots Attempted: 42.7% Rim, 17.5% Non-Rim Twos, 39.8% Threes
  • Shots Made by Category: 64.4% Rim, 38.6% Non-Rim Twos, 33.4% 3PT
  • Tempo: 76.57 possessions (#3 of 353)

23. Our Lady of the Lake Saints (San Antonio, TX): 0.938 PPP

  • Best Play Types (90th-percentile or higher): Transition (97th), Spot-Up (90th)
  • Percentage of Shots Attempted: 42.4% Rim, 27.7% Non-Rim Twos, 29.9% Threes
  • Shots Made by Category: 57.5% Rim, 37.8% Non-Rim, 33.8% 3PT
  • Tempo: 88.79 possessions (#1 of 353)

22. Drury Panthers (Springfield, MO): 0.938 PPP

  • Best Play Types (90th-percentile or higher): P&R Ball Handler (96th), Transition (93rd)
  • Percentage of Shots Attempted: 42.6% Rim, 25.9% Non-Rim Twos, 31.5% Threes
  • Shots Made by Category: 60.1% Rim, 38.8% Non-Rim Twos, 36.7% 3PT
  • Tempo: 80.46 possessions (#1 of 353)

21. UAB Blazers (Birmingham, AL): 0.939 PPP

  • Best Play Types (90th-percentile or higher): Spot-Up (100th), Cuts (98th), P&R Ball Handler (97th)
  • Percentage of Shots Attempted: 34.9% Rim, 24.4% Non-Rim Twos, 40.7% Threes
  • Shots Made by Category: 61.7% Rim, 32.9% Non-Rim Twos, 37.7% 3PT
  • Tempo: 69.97 possessions (#121 of 353)

20. Union Bulldogs (Jackson, TN): 0.94 PPP

  • Best Play Types (90th-percentile or higher): Spot-Up (99th), P&R Ball Handler (99th), Transition (98th)
  • Percentage of Shots Attempted: 41.5% Rim, 28% Non-Rim Twos, 30.5% Threes
  • Shots Made by Category: 56.4% Rim, 43.6% Non-Rim Twos, 40.3% 3PT
  • Tempo: 74.01 possessions (#19 of 353)

19. Marist Red Foxes (Poughkeepsie, NY): 0.941 PPP

  • Best Play Types (90th-percentile or higher): Cuts (99th), Spot-Up (94th), Transition (90th)
  • Percentage of Shots Attempted: 34.8% Rim, 28.1% Non-Rim Twos, 37.1% Threes
  • Shots Made by Category: 63.3% Rim, 44% Non-Rim Twos, 35.9% 3PT
  • Tempo: 68.46 possessions (#217 of 353)

18. Nebraska-Kearney Lopers (Kearney, NE): 0.942 PPP

  • Best Play Types (90th-percentile or higher): Cuts (98th), Spot-Up (97th), Post-Up (90th)
  • Percentage of Shots Attempted: 45% Rim, 16.6% Non-Rim Twos, 38.4% Threes
  • Shots Made by Category: 59.2% Rim, 38% Non-Rim Twos, 34.5% 3PT
  • Tempo: 70.76 possessions (#84 of 353)

17. Southeastern Fire (Lakeland, FL): 0.945 PPP

  • Best Play Types (90th-percentile or higher): Post-Up (99th), Spot-Up (97th), Cuts (96th), Transition (90th)
  • Percentage of Shots Attempted: 53.9% Rim, 14.3% Non-Rim Twos, 31.8% Threes
  • Shots Made by Category: 60.9% Rim, 40.5% Non-Rim Twos, 34.7% 3PT
  • Tempo: 77.34 possessions (#3 of 353)

16. Connecticut Huskies (Mansfield, CT): 0.946 PPP

  • Best Play Types (90th-percentile or higher): Transition (99th), Spot-Up (96th), Post-Up (93rd)
  • Percentage of Shots Attempted: 38.4% Rim, 26.5% Non-Rim Twos, 35.1% Threes
  • Shots Made by Category: 61.5% Rim, 38.5% Non-Rim Twos, 39.4% 3PT
  • Tempo: 70.7 possessions (#86 of 353)

15. Baylor Lady Bears (Waco, TX): 0.947 PPP

  • Best Play Types (90th-percentile or higher): Spot-Up (99th), Post-Up (98th), Transition (97th), Cuts (96th)
  • Percentage of Shots Attempted: 47.3% Rim, 34.8% Non-Rim Twos, 17.9% Threes
  • Shots Made by Category: 59.8% Rim, 42.1% Non-Rim Twos, 37.9% 3PT
  • Tempo: 73.57 possessions (#25 of 353)

14. Florida Gulf Coast Eagles (Fort Myers, FL): 0.948 PPP

  • Best Play Types (90th-percentile or higher): Spot-Up (97th), Transition (96th)
  • Percentage of Shots Attempted: 36.9% Rim, 9% Non-Rim Twos, 54.1% Threes
  • Shots Made by Category: 56.1% Rim, 35.4% Non-Rim Twos, 33.7% 3PT
  • Tempo: 73.32 possessions (#27 of 353)

13. Westmont Warriors (Santa Barbara, CA): 0.954 PPP

  • Best Play Types (90th-percentile or higher): Transition (100th), P&R Ball Handler (99th), Spot-Up (98th)
  • Percentage of Shots Attempted: 30.6% Rim, 18.1% Non-Rim Twos, 51.3% Threes
  • Shots Made by Category: 51.4% Rim, 39.3% Non-Rim Twos, 37% 3PT
  • Tempo: 65.5 possessions (#329 of 353)

12. Iowa Hawkeyes (Iowa City, IA): 0.954 PPP

  • Best Play Types (90th-percentile or higher): Post-Up (100th), Spot-Up (95th), Transition (95th), Cuts (91st)
  • Percentage of Shots Attempted: 40.5% Rim, 22.5% Non-Rim Twos, 37% Threes
  • Shots Made by Category: 63.3% Rim, 40.1% Non-Rim Twos, 36.5% 3PT
  • Tempo: 74.27 possessions (#13 of 353)

11. Indiana Tech Warriors (Fort Wayne, IN): 0.963 PPP

  • Best Play Types (90th-percentile or higher): Cuts (99th), Spot-Up (98th), Transition (98th)
  • Percentage of Shots Attempted: 46.2% Rim, 17% Non-Rim Twos, 36.8% Threes
  • Shots Made by Category: 61.4% Rim, 33.2% Non-Rim Twos, 36.5% 3PT
  • Tempo: 73.35 possessions (#25 of 353)

10. Bryan College Lions (Dayton, TN): 0.965 PPP

  • Best Play Types (90th-percentile or higher): Spot-Up (100th), Cuts (100th), P&R Ball Handler (93rd)
  • Percentage of Shots Attempted: 45.2% Rim, 11.2% Non-Rim Twos, 43.6% Threes
  • Shots Made by Category: 55.3% Rim, 37.8% Non-Rim Twos, 37.1% 3PT
  • Tempo: 78.29 possessions (#2 of 353)

9. Abilene Christian Wildcats (Abilene, TX): 0.969 PPP

  • Best Play Types (90th-percentile or higher): Cuts (100th), Spot-Up (99th), P&R Ball Handler (99th), Post-Up (99th), Transition (96th)
  • Percentage of Shots Attempted: 47% Rim, 6.8% Non-Rim Twos, 46.2% Threes
  • Shots Made by Category: 59.3% Rim, 37.5% Non-Rim Twos, 38% 3PT
  • Tempo: 71.59 possessions (#58 of 353)

8. Arkansas Razorbacks (Fayetteville, AR): 0.976 PPP

  • Best Play Types (90th-percentile or higher): Transition (100th), P&R Ball Handler (95th), Spot-Up (94th)
  • Percentage of Shots Attempted: 37.2% Rim, 23.5% Non-Rim Twos, 39.3% Threes
  • Shots Made by Category: 54.8% Rim, 37.5% Non-Rim Twos, 38% 3PT
  • Tempo: 76.08 possessions (#4 of 353)

7. Wartburg Knights (Waverly, IA): 0.978 PPP

  • Best Play Types (90th-percentile or higher): Spot-Up (100th), Transition (100th), Cuts (100th), Post-Up (96th)
  • Percentage of Shots Attempted: 45.3% Rim, 7.3% Non-Rim Twos, 47.4% Threes
  • Shots Made by Category: 62.4% Rim, 40% Non-Rim Twos, 35.8% 3PT
  • Tempo: 73.61 possessions (#24 of 353)

6. South Dakota Coyotes (Vermillion, SD): 0.98 PPP

  • Best Play Types (90th-percentile or higher): Spot-Up (99th), Cuts (98th), Transition (97th), Post-Up (97th), P&R Ball Handler (97th)
  • Percentage of Shots Attempted: 40.3% Rim, 25.7% Non-Rim Twos, 34% Threes
  • Shots Made by Category: 61.1% Rim, 38.8% Non-Rim Twos, 37.7% 3PT
  • Tempo: 71.3 possessions (#65 possessions)

5. Glenville State Pioneers (Glenville, WV): 0.982 PPP

  • Best Play Types (90th-percentile or higher): P&R Ball Handler (100th), Spot-Up (99th), Transition (92nd)
  • Percentage of Shots Attempted: 37.9% Rim, 21.3% Non-Rim Twos, 40.8% Threes
  • Shots Made by Category: 62.7% Rim, 39.2% Non-Rim Twos, 35.2% 3PT
  • Tempo: 89.41 possessions (#1 of 353)

4. Taylor University Trojans (Upland, IN): 0.983 PPP

  • Best Play Types (90th-percentile or higher): Spot-Up (100th), Transition (100th), Cuts (93rd)
  • Percentage of Shots Attempted: 36% Rim, 13.3% Non-Rim Twos, 50.7% Threes
  • Shots Made by Category: 55% Rim, 36.8% Non-Rim Twos, 40.7% 3PT
  • Tempo: 69.04 possessions (#177 of 353)

3. Walsh Cavaliers (North Canton, OH): 0.984 PPP

  • Best Play Types (90th-percentile or higher): Spot-Up (98th), Transition (98th)
  • Percentage of Shots Attempted: 46.4% Rim, 24.9% Non-Rim Twos, 28.5% Threes
  • Shots Made by Category: 60.7% Rim, 40.9% Non-Rim Twos, 38% 3PT
  • Tempo: 76.25 possessions (#3 of 353)

2. Ashland Eagles (Ashland, OH): 1.045 PPP

  • Best Play Types (90th-percentile or higher): Everything but Post-Up (89th) and P&R Roll Man (70th)
  • Percentage of Shots Attempted: 46.2% Rim, 21.8% Non-Rim Twos, 32% Threes
  • Shots Made by Category: 61.8% Rim, 44.5% Non-Rim Twos, 46.2% 3PT
  • Tempo: 75.37 possessions (#7 of 353)

1. Oregon Ducks (Eugene, OR): 1.054 PPP

  • Best Play Types (90th-percentile or higher): Every single play type not named Hand-Off (61st). Of the 11 play types offered, Oregon ranked in the 98th-percentile or higher in ten.
  • Percentage of Shots Attempted: 37% Rim, 25.1% Non-Rim Twos, 37.9% Threes
  • Shots Made by Category: 66.1% Rim, 45.7% Non-Rim Twos, 38.7% 3PT
  • Tempo: 69.52 possessions (#145 of 353)

If you’d like to see more of this, tag me on Twitter @statsbywill or email me statsbywill@gmail.com.

The best offenses in men’s college basketball, 2019-20

Last year, a couple of weeks after the college basketball season, I made my deep exploration into the best men’s college basketball offenses in 2018-19. It led to a full summer of exploring these offenses in greater detail, complete with interviews with coaches and a whole lot of GIFs and game-watching. I loved doing it; it only makes sense that I would do it again.

This year, I decided to expand the, uh, “search” to the top 25 across all levels. Why? Well, why not. SO: here are the very best college basketball offenses of the last five months. I’m doing this in a few different ways than usual. This particular ranking is from Synergy Sports. However, for last year’s KenPom-style ratings, I’ll include that top 25 on the next page, along with the top 25 half-court offenses. It just felt fair to pay tribute to the service that works for all levels of college basketball.

Per Synergy Sports, here were the 25 best offenses of the 2019-20 men’s college basketball season. Below is each team’s shot chart, their best play types, shooting splits, and tempo, which is calculated via Ken Pomeroy’s equation on the next page.

25. Briar Cliff Chargers (Sioux City, IA)

  • Points Per Possession: 1.036
  • Best Play Types (90th-percentile or higher): P&R Ball Handler (99th-percentile); Spot-Up (97th-percentile); P&R Roll Man (96th-percentile); ranked in 100th-percentile on P&R as a whole
  • Percentage of Shots Attempted: 39% Rim (any attempt within 4 feet of the rim), 12% Non-Rim Twos, 49% Threes
  • Shots Made by Category: 61.6% Rim, 38.5% Non-Rim Twos, 39.2% 3PT
  • Tempo: 70.22 possessions (would have ranked 114th of 353 in D-1)

24. Yeshiva Maccabees (New York, NY)

  • Points Per Possession: 1.037
  • Best Play Types: Spot-Up (99th), Transition (98th)
  • Percentage of Shots Attempted: 45.9% Rim, 16% Non-Rim Twos, 38.1% Threes
  • Shots Made by Category: 65.1% Rim, 46% Non-Rim Twos, 39.6% 3PT
  • Tempo: 78.07 possessions (2nd of 353)

23. Brigham Young Cougars (Provo, UT)

  • Points Per Possession: 1.039
  • Best Play Types: Spot-Up (99th), P&R Roll Man (99th), P&R Ball Handler (97th), Post-Up (92nd), 99th-percentile on P&R as a whole
  • Percentage of Shots Attempted: 26% Rim, 32.5% Non-Rim Twos, 41.5% Threes
  • Shots Made by Category: 69.4% Rim, 44.4% Non-Rim Twos, 42.2% 3PT
  • Tempo: 69.7 possessions (133rd of 353)

22. Western Oregon Wolves (Monmouth, OR)

  • Points Per Possession: 1.04
  • Best Play Types: Spot-Up (99th), Post-Up (93rd)
  • Percentage of Shots Attempted: 39.5% Rim, 17.9% Non-Rim Twos, 42.7% Threes
  • Shots Made by Category: 62.2% Rim, 39.5% Non-Rim Twos, 40.5% 3PT
  • Tempo: 75.33 possessions (7th of 353)

21. Walsh Cavaliers (North Canton, OH)

  • Points Per Possession: 1.041
  • Best Play Types: Transition (97th), P&R Ball Handler (97th), Spot-Up (96th), Isolation (93rd), 95th-percentile P&Rs
  • Percentage of Shots Attempted: 36.8% Rim, 19% Non-Rim Twos, 44.2% Threes
  • Shots Made by Category: 61.3% Rim, 41.9% Non-Rim Twos, 41.3% 3PT
  • Tempo: 70.35 possessions (111th of 353)

20. Gonzaga Bulldogs (Spokane, WA)

  • Points Per Possession: 1.041
  • Best Play Types: Post-Up (98th), P&R Ball Handler (97th), P&R Roll Man (97th), Spot-Up (93rd), 100th-percentile P&Rs, 96th-percentile post-ups
  • Percentage of Shots Attempted: 46.1% Rim, 22.6% Non-Rim Twos, 31.3% Threes
  • Shots Made by Category: 65.2% Rim, 41.3% Non-Rim Twos, 38.6% 3PT
  • Tempo: 72.6 possessions (36th of 353)

19. Dayton Flyers (Dayton, OH)

  • Points Per Possession: 1.041
  • Best Play Types: Cuts (99th), Spot-Up (97th), Transition (97th), 98th-percentile P&R
  • Percentage of Shots Attempted: 40.5% Rim, 20.5% Non-Rim, 39% Threes
  • Shots Made by Category: 71.5% Rim, 44.1% Non-Rim, 37.1% Threes
  • Tempo: 68.0 possessions (233rd of 353)

18. St. John’s Johnnies (St. Joseph, MN)

  • Points Per Possession: 1.042
  • Best Play Types: Spot-Up (98th), Hand-Off (94th), Post-Up (92nd)
  • Percentage of Shots Attempted: 43.6% Rim, 21.2% Non-Rim Twos, 35.2% Threes
  • Shots Made by Category: 63.6% Rim, 44.8% Non-Rim Twos, 38.8% 3PT
  • Tempo: 63.08 possessions (351st of 353)

17. Linfield College Wildcats (McMinnville, OR)

  • Points Per Possession: 1.042
  • Best Play Types: Spot-Up (100th), Transition (95th)
  • Percentage of Shots Attempted: 41.6% Rim, 15.9% Non-Rim Twos, 42.5% Threes
  • Shots Made by Category: 64.9% Rim, 41.7% Non-Rim Twos, 39.1% 3PT
  • Tempo: 76.84 possessions (3rd of 353)

16. Nebraska Wesleyan Prairie Wolves (Lincoln, NE)

  • Points Per Possession: 1.044
  • Best Play Types: Isolation (100th), Cuts (99th), Transition (97th)
  • Percentage of Shots Attempted: 39.8% Rim, 16.8% Non-Rim Twos, 43.4% Threes
  • Shots Made by Category: 67.4% Rim, 45.8% Non-Rim Twos, 35.8% 3PT
  • Tempo: 70.76 possessions (84th of 353)

15. Michigan Tech Huskies (Houghton, MI)

  • Points Per Possession: 1.045
  • Best Play Types: Spot-Up (100th), Cuts (99th), Transition (98th)
  • Percentage of Shots Attempted: 32.9% Rim, 26.5% Non-Rim Twos, 40.6% Threes
  • Shots Made by Category: 61.1% Rim, 40.8% Non-Rim Twos, 43.4% 3PT
  • Tempo: 67.8 possessions (242nd of 353)

14. Bellarmine Knights (Louisville, KY)

  • Points Per Possession: 1.046
  • Best Play Types: Transition (99th)
  • Percentage of Shots Attempted: 42.1% Rim, 23.3% Non-Rim Twos, 34.6% Threes
  • Shots Made by Category: 66.5% Rim, 40.4% Non-Rim Twos, 39.5% Threes
  • Tempo: 66.67 possessions (287th of 353)

13. Lewis-Clark State Warriors (Lewiston, ID)

  • Points Per Possession: 1.048
  • Best Play Types: Spot-Up (99th), Post-Up (97th), 94th-percentile P&R
  • Percentage of Shots Attempted: 37.5% Rim, 17.9% Non-Rim Twos, 44.6% Threes
  • Shots Made by Category: 61.5% Rim, 43.7% Non-Rim Twos, 42% 3PT
  • Tempo: 71.25 possessions (65th of 353)

12. Mount Union Raiders (Alliance, OH)

  • Points Per Possession: 1.049
  • Best Play Types: Spot-Up (99th), Transition (98th), Cut (97th), P&R Ball Handler (94th), 99th-percentile P&R
  • Percentage of Shots Attempted: 40.6% Rim, 18.7% Non-Rim Twos, 40.7% Threes
  • Shots Made by Category: 65.3% Rim, 38.8% Non-Rim Twos, 38.7% 3PT
  • Tempo: 71.66 possessions (56th of 353)

11. Jefferson University Rams (Philadelphia, PA)

  • Points Per Possession: 1.05
  • Best Play Types: P&R Ball Handler (94th), Cuts (94th), Transition (92nd)
  • Percentage of Shots Attempted: 37.8% Rim, 26.1% Non-Rim Twos, 36.1% Threes
  • Shots Made by Category: 65.3% Rim, 39.6% Non-Rim Twos, 41.4% 3PT
  • Tempo: 68.51 possessions (210th of 353)

10. St. Thomas Tommies (St. Paul, MN)

  • Points Per Possession: 1.055
  • Best Play Types: P&R Ball Handler (98th), Spot-Up (96th), Post-Up (96th), 99th-percentile P&R
  • Percentage of Shots Attempted: 38.8% Rim, 13.5% Non-Rim Twos, 47.7% Threes
  • Shots Made by Category: 61.1% Rim, 41.8% Non-Rim Twos, 38% 3PT
  • Tempo: 69.39 possessions (152nd of 353)

9. Morningside College Mustangs (Sioux City, IA)

  • Points Per Possession: 1.057
  • Best Play Types: Cuts (99th), Spot-Up (98th), Post-Up (96th), P&R Ball Handler (92nd), 99th-percentile all post-ups
  • Percentage of Shots Attempted: 48.9% Rim, 15% Non-Rim Twos, 36.1% Threes
  • Shots Made by Category: 64.7% Rim, 43.8% Non-Rim Twos, 39.6% 3PT
  • Tempo: 71.37 possessions (63rd of 353)

8. West Liberty Hilltoppers (West Liberty, WV)

  • Points Per Possession: 1.061
  • Best Play Types: Spot-Up (98th), Hand-Off (94th), Transition (89th)
  • Percentage of Shots Attempted: 45.5% Rim, 16.3% Non-Rim Twos, 38.2% Threes
  • Shots Made by Category: 61.6% Rim, 39.2% Non-Rim Twos, 40.7% 3PT
  • Tempo: 81.03 possessions (1st of 353)

7. Olivet Nazarene Tigers (Bourbonnais, IL)

  • Points Per Possession: 1.063
  • Best Play Types: Post-Up (100th), Spot-Up (99th), Cuts (93rd), Transition (92nd), 97th-percentile P&Rs
  • Percentage of Shots Attempted: 45.7% Rim, 17% Non-Rim Twos, 37.3% Threes
  • Shots Made by Category: 62.8% Rim, 38.6% Non-Rim Twos, 40.2% 3PT
  • Tempo: 75.51 possessions (7th of 353)

6. Marian Knights (Indianapolis, IN)

  • Points Per Possession: 1.065
  • Best Play Types: Transition (96th), Spot-Up (94th)
  • Percentage of Shots Attempted: 43.9% Rim, 21.7% Non-Rim Twos, 34.4% Threes
  • Shots Made by Category: 61.9% Rim, 40.5% Non-Rim Twos, 43.5% 3PT
  • Tempo: 72.53 possessions (37th of 353)

5. Indiana Wesleyan Wildcats (Marion, IN)

  • Points Per Possession: 1.068
  • Best Play Types: Post-Up (100th), P&R Ball Handler (98th), Transition (96th), Cuts (96th), Spot-Up (94th)
  • Percentage of Shots Attempted: 48.7% Rim, 15.1% Non-Rim Twos, 36.2% Threes
  • Shots Made by Category: 65.4% Rim, 46% Non-Rim Twos, 39.3% 3PT
  • Tempo: 75.1 possessions (8th of 353)

4. Nova Southeastern Sharks (Ft. Lauderdale, FL)

  • Points Per Possession: 1.078
  • Best Play Types: Cuts (96th), P&R Ball Handler (93rd), Spot-Up (90th)
  • Percentage of Shots Attempted: 44% Rim, 22.9% Non-Rim Twos, 33.1% Threes
  • Shots Made by Category: 65% Rim, 45.7% Non-Rim Twos, 41.9% 3PT
  • Tempo: 81.51 possessions (1st of 353)

3. Lincoln Memorial Railsplitters (Harrogate, TN)

  • Points Per Possession: 1.081
  • Best Play Types: Spot-Up (99th), Cuts (99th), P&R Ball Handler (99th), 97th-percentile P&Rs
  • Percentage of Shots Attempted: 45.9% Rim, 9.8% Non-Rim Twos, 45.3% Threes
  • Shots Made by Category: 65% Rim, 44.1% Non-Rim Twos, 40.6% 3PT
  • Tempo: 78.32 possessions (2nd of 353)

2. UC San Diego Tritons (San Diego, CA)

  • Points Per Possession: 1.095
  • Best Play Types: Cuts (100th), Spot-Up (99th), Transition (98th), 96th-percentile P&Rs
  • Percentage of Shots Attempted: 33.9% Rim, 13% Non-Rim Twos, 53.1% Threes
  • Shots Made by Category: 68% Rim, 43.5% Non-Rim Twos, 40.1% 3PT
  • Tempo: 69.39 possessions (152nd of 353)

1. Northwest Missouri State Bearcats (Maryville, MO)

  • Points Per Possession: 1.146
  • Best Play Types: Every single play type but P&R Roll Man (82nd) and Hand-Offs (74th). Literally every one.
  • Percentage of Shots Attempted: 42% Rim, 12.9% Non-Rim Twos, 45.1% Threes
  • Shots Made by Category: 62.5% Rim, 46.3% Non-Rim Twos, 45% 3PT
  • Tempo: 64.85 possessions (337th of 353)

NEXT PAGE: Top 25 via traditional possession calculations; top 25 half-court offenses

The 64 best NCAA Tournament games of all time (sort of)

Obviously, this sucks. It’s going to suck for a while, and it’s going to be much worse before it gets better. That said: if we are all going to be isolated from each other, we can still enjoy each other’s company digitally.

To cope with this from a basketball standpoint, I’ve decided to create my personal list of the 64 best NCAA Tournament games of all time. What this means is the following:

  • Each round, I’ll be showing off what I believe are the best games, split by seed line. For the Round of 64, that means there’s four 1 vs. 16 games, four 2 vs. 15s, four 3 vs. 14s, etc. Round of 32: two 1/16 vs. 8/9s, etc.
  • This will follow round-by-round. Starting in the Sweet Sixteen, there will be no seed limitations, as by then, there’s too many possibilities, but across the first two rounds, all games will be given out to seed lines to the best of my ability.
  • I can’t promise these are, uh, comprehensive. I’m 26 and the first NCAA Tournament I can remember watching in earnest is either 2001 (title game only) or 2002 (Sweet Sixteen onward). If you like a different game more than the one posted, tell me!
  • I based my selections on two criteria: was this game great and is the full version (or at least extended highlights) available on YouTube. That cut out some phenomenal games, but they were necessary sacrifices. We’ve got to use as much of this free time as possible.

As an introduction – and to get us to 64 games – here is the best First Four game ever: Western Kentucky-Mississippi Valley State, 2012.

Here’s the Round of 64. I hope you enjoy.

Round of 64

1 vs. 16

UMBC-Virginia, 2018.

I think this is a pretty obvious one, as it will now be the only 16-over-1 upset for another year.

Georgetown-Princeton, 1989.

For a long time, this held the standard as the preeminent Close Call. Princeton maybe/maybe didn’t get fouled on the final play of the game; watch and make the call.

Oklahoma-East Tennessee State, 1989. 

But this one is somehow forgotten. ETSU has a wild Tournament history; entering the 1989 Tournament at 20-11 and fourth in the SoCon only to lead 1 SEED OKLAHOMA BY 17 POINTS in the first half seems like it tops the list.

Gonzaga-Southern, 2012. 

There’s a very specific moment in this game – for me, when Southern cuts it to 54-52 – where I really did think I was about to see a 16 seed finally do it.

2 vs. 15

Duke-Lehigh, 2012.

It’s Duke. I can’t not put this on here, man.

Georgetown-Florida Gulf Coast, 2013.

Despite being a worse game, this one beat out both Hampton-Iowa State and Norfolk State-Missouri for mere shock value. It’s one thing when a 15 seed wins; it’s another when a 15 seed totally, systematically demolishes their opponent. I had never seen anything like it since I’d started watching the Tournament.

Robert Morris-Villanova, 2010. 

It sucked not getting this one, to be honest. Robert Morris led almost the entire way, led by eight points with nine minutes to play, and just couldn’t pull it off. Villanova would lose two days later, blunting the impact of this one down the road, but as a game, it beats the pants off of several of the actual upsets.

Tennessee-Winthrop, 2006.

Same with this one. It was a very good game made better by the presence of a buzzer-beater. Winthrop was coached by a dude named Gregg Marshall – heard of him? – and this was Bruce Pearl’s first year at Tennessee. Again, Tennessee lost two days later, but the tension of this game over the final five minutes is sky-high.

3 vs. 14

North Carolina-Weber State, 1999.

Harold Arceneaux is the exact type of small-school player every high seed fears in March.

Baylor-Georgia State, 2015.

For 37 minutes, this was a pretty boring game. However: the final three minutes are delirious.

Marquette-Davidson, 2013.

This one has sadly been lost to time in terms of a full game upload, but the ending is all you really need. 14 seed Davidson came out and owned the game for 39 minutes; unfortunately, you play 40.

Michigan-Pepperdine, 1994.

Not a ton to work with here; the number of great 3/14 games aren’t very high. But this one gets unfairly looked over. Minus Chris Webber, this is Fab Five-era Michigan needing overtime to get past a 14 seed. It’s worth a look.

4 vs. 13

UCLA-Princeton, 1996.

Had Belmont completed the backdoor play last March, it would’ve felt the exact same way as this did for basketball nerds in 1996.

Ole Miss-Valparaiso, 1998.

You see the final play every year, obviously. But did you know it was a four-point game at halftime and within five points for basically the entire second half? Tense!

Louisville-Morehead State, 2011.

Annoyingly, this is all that’s on YouTube…..but that shot is worth inclusion alone.

Syracuse-Vermont, 2005.

On any list of “Greatest Gus Johnson Exclamations in American History,” the part where he starts to say T.J. Sorrentine’s name and just goes “SssssssssssssOHHHHHHHHHHHHHHHH” is #1.

5 vs. 12

Florida-Creighton, 2002.

This game is secretly one of the five best of this first round.

  1. Double overtime!
  2. KYLE KORVER!
  3. A BUZZER BEATER!
  4. One-point final margin!
  5. Udonis Haslem!
  6. Also, the play where Florida deflected the ball out of bounds and the Creighton player holds him back….probably a foul now, yeah?

Drake-Western Kentucky, 2008.

Here’s the thing. If it’s just that buzzer-beater in an otherwise forgettable game, it’s still a good game, because there’s a buzzer-beater. But when you factor in that Drake’s best team ever made a 17-point second half comeback to force overtime, the final score was 101-99, and the guy who made the shot was an otherwise-unnotable four-year Western Kentucky player, it’s basically all of what March Madness is supposed to be. I think this is my personal favorite game of the first 32.

Saint Louis-NC State, 2014.

I picked NC State in this game and still get chest pains every time I see a Wolfpack player step to the line in the final seconds.

Auburn-New Mexico State, 2019.

I had Auburn in the Final Four because I thought it was a very good value pick. It made me look really smart for 39 minutes or so and made me want to die for one. The final 30 seconds or so of this game are genuinely unbelievable.

6 vs. 11

Duke-VCU, 2007.

If you were 16 years or younger in 2007 you thought Eric Maynor was going to be what DeMar DeRozan ended up being.

Miami (FL)-Loyola Chicago, 2018.

Pretty much a perfect finish. The team vying for the upset hasn’t played in the NCAA Tournament since 1985, let alone won a game; the team on top has the head coach of maybe the most famous 11 seed to ever make the Final Four. And the final shot, from the logo…genuinely, had Loyola not defeated Tennessee in the next round, I would have been able to watch this a much happier man.

Iowa-George Washington, 1996.

Not one anyone remembers (I had to do some research on it myself), but a phenomenal game. Iowa comes back from 17 points down in the final eight minutes to win in regulation. Iowa would relive this from the other side of the ball against Northwestern State exactly ten years later.

Maryland-Belmont, 2019.

Watching this and not rooting for Belmont should have been a crime.

7 vs. 10

Nevada-Texas, 2018.

Sometimes I like thinking about how Nevada overcame a 14-point deficit and a 22-point deficit in the span of 48 hours or so to make the Sweet Sixteen.

Michigan-Oklahoma State, 2017.

This was a very rare game: a non-marquee matchup that received a lot of hype and fully lived up to it. It was two of the best offenses in basketball and two very, very good teams that were underseeded. Arguably Derrick Walton’s finest performance. Also arguably the game that got DJ Wilson drafted in the first round.

Gonzaga-Davidson, 2008.

An unfortunate thing about the Stephen Curry Elite Eight run is that, after the first two rounds, the Sweet Sixteen game was over with ten minutes left and the Elite Eight game was a brickfest. That left this game or the Georgetown comeback, and I think this one’s just straight-up better.

Connecticut-St. Joseph’s, 2014.

I still genuinely cannot process that a team that had to go to overtime with a 10 seed on the first day of the NCAA Tournament won the whole thing.

8 vs. 9

Ohio State-Siena, 2009.

Here’s a game that no one remembers but was so, so fun. Siena’s return to the Tournament came after they defeated 4 seed Vanderbilt by 21 points the year before. They faced off against the first post-Greg Oden Ohio State team to get into the Tournament, the game went to double overtime, and you had a phenomenal finish complete with a clutch three-pointer to win it.

Texas-Wake Forest, 2010.

This is the only game on the list that doesn’t have video to go with it, unfortunately. But: it is the game that made me fear Rick Barnes.

Cincinnati-Purdue, 2015.

This game had a buzzer-beater to get to overtime, a near-buzzer-beater that would’ve won it and overtime, and had the incredible storyline of Cincinnati’s coach watching the game from home due to a health scare.

Western Kentucky-Michigan, 1995.

As you’re seeing on this list, one of the easiest ways to ensure you’re watching a great college basketball game in March is to put Western Kentucky in it. I don’t know what it is about this program, but they always bring the goods.

NEXT PAGE: Round of 32 & Sweet Sixteen

How the stats would’ve picked this year’s (theoretical) 2020 NCAA Tournament

BIG OL’ EDITOR’S NOTEEverything you are reading, as follows, is a hypothetical simulation. The 2020 NCAA Tournament obviously did not happen, but I’ve pieced together a field that A. seems realistic and B. helps me waste more time by thinking about it.

So, here we are. I don’t know how much everyone reading this has changed their lives to reflect our global issues, but I do think we all should. The NCAA certainly did, and it’s tough to be rational about it, but we have to. That said, this is our time.

Something I’ve done just about every year since I knew what statistics were was create a mock NCAA Tournament bracket before the real one. This bracket would reflect how I would pick every game when the time came simply because I like being prepared. For the 2019 Tournament, I created a Google Doc that had stats for every seed line. All of this, objectively, would sound purely ridiculous to someone who spends less than ~2 months of the year thinking about college basketball. And yet: I got three of the four Final Four teams right and you didn’t. I’m sorry, that’s a ridiculous brag, but I had to fit it in somewhere.

Anyway, that’s a long way of saying that in the midst of the NCAA Tournament uncertainty on Thursday, I decided to create a fake bracket on my lunch break at my day job. The Google Doc for this one is titled “Let’s have some fun,” because it should be. Here’s how I made my field of 68:

  • For the most part, I just took the highest-rated conference champion for the Big Six and assumed no bid thieves. Cincinnati technically won the AAC due to the cancellations, so I let them in without a further simulation.
  • For the other 26 conferences, I ran RAND() functions in Excel based on the likelihood that the best team in each conference would win it. This was to reflect that upsets frequently happen in conference tournaments. As such, we ended up with 11 non-first-place conference tournament winners, which is actually a little lower than you’d expect, but makes sense given our restrictions. To save time, every conference that had a team at >50% to win the conference tournament was given a pass into the field. Seemed fair and seemed realistic; I am not God.
  • At-larges made the field on a combination of their Bracket Matrix average seed and Bart Torvik’s projected average seed. This shifted the field a small amount, but 66 of the 68 teams that would’ve made the Matrix’s field of 68 as an at-large made mine. (Xavier and NC State are in my field, while UCLA and Stanford are not. Sorry to all Pac-12 fans; I can create a contingency bracket if you want.)
  • Lastly, the field was seeded 1-68 on said seeding combination. It feels right, and I like how it turned out.

Enough wailing. Here’s your field. Where necessary, I’ve included an asterisk* where the conference champion was someone other than the 1 seed.

The 2020 Will Warren Invitational Field of 68

  • 1 seeds: Kansas, Gonzaga, Baylor, Dayton
  • 2 seeds: San Diego State, Florida State, Villanova, Michigan State
  • 3 seeds: Creighton, Duke, Maryland, Seton Hall
  • 4 seeds: Oregon, Kentucky, Louisville, Ohio State
  • 5 seeds: Wisconsin, Butler, BYU, West Virginia
  • 6 seeds: Michigan, Auburn, Penn State, Iowa
  • 7 seeds: Virginia, Illinois, Arizona, Houston
  • 8 seeds: Colorado, St. Mary’s (CA), Providence, Marquette
  • 9 seeds: Rutgers, LSU, Florida, Oklahoma
  • 10 seeds: USC, Texas Tech, Indiana, Arizona State
  • 11 seeds: Utah State, Wichita State/Xavier, Cincinnati, East Tennessee State
  • 12 seeds: Richmond/NC State, Yale, Stephen F. Austin, Liberty
  • 13 seeds: Vermont, New Mexico State, Belmont, Western Kentucky*
  • 14 seeds: Bradley*, Hofstra, Northern Colorado*, North Dakota State*
  • 15 seeds: Texas State*, Winthrop*, Northern Kentucky*, Ohio*
  • 16 seeds: UC Santa Barbara*, Boston University*, Siena/North Carolina Central, Robert Morris/Jackson State*

First four out: Stanford, Texas, UCLA, Mississippi State
Next four out: Northern Iowa, Purdue, Arkansas, Oklahoma State

A quick Q&A session, based on questions I would imagine people asking:

  • Why is Baylor the third overall seed? By Kansas winning the Big 12 Tournament here, we’re assuming Baylor now has four losses on the season, which, in my mind, would elevate Gonzaga to the second overall seed. I don’t know, dude, I just did it because I felt like it.
  • Explain Creighton and Duke as 3 seeds. Creighton was white hot down the stretch of the season; Duke was not, but they are named Duke, so we all rightfully expect them to win the ACC. Again, in our simulation, Florida State won it, so a 3 seed feels accurate. Meanwhile, Creighton did win the Big East in this simulation, but Villanova ranked ahead of them. Why? 1. Ask someone who does this for a living I really don’t know. 2. It actually isn’t that absurd; by Wins Above Bubble, Villanova ranks 7th and Creighton 9th.
  • Kentucky as a 4??? Hater! Correct! I do not like Kentucky. Anyway, this is a team that didn’t crack the KenPom top 20 after January and closed the season 12th in WAB. I’m gonna guess that the teams in actual good conferences would’ve gotten the nod ahead of them. Everyone really undersold how awful it was to watch SEC basketball this season.
  • Explain the Last Four In. Again, not God, but a very white guy who’s drinking coffee out of a Charleston Rainbow Row cup as I type. Anyway:
    • Wichita State ranked 31st in WAB, had good metrics across Torvik and KenPom, and, in our simulation, wins at least one AAC Tournament game.
    • Xavier only ranked 46th, but they had no true bad losses (16-2 against Qs 2-4) and had a true marquee win: their 74-62 road victory over Seton Hall in early February.
    • Richmond: 38th in WAB, made the A10 championship game in our simulation. Xavier got the 11 seed nod only because they were in a significantly stronger conference.
    • NC State: On first run, this was Stanford, but then Stanford totally blew it to Cal in their lone Pac-12 Tournament game…which pushed NCSU just over the edge. They ranked almost exactly the same in metrics averages, but NCSU had a slightly better WAB with one additional Q1&Q2 win. I don’t like either team, to be honest.
  • Explain those who got left out. Just discussed Stanford. UCLA had a worse WAB than any of the four who got in and farted around for half the season. Texas did have a good-enough WAB at 39th but left an awful impression on the committee with a Big 12 quarterfinals loss to Texas Tech, another bubble team. Mississippi State lost to Florida in the SEC quarterfinals and had a worse WAB than the four who got in. The only team in Next Four Out that had a realistic case to me was Northern Iowa, who ranked 41st in WAB, but I simply couldn’t imagine a committee rewarding a blowout MVC quarters loss to Drake with even a First Four Out nod, sadly.

Okay! That’s a lot of words! You came here for a bracket.

The Will Warren 2020 Invitational Bracket

right-click and hit Open in New Tab to see this image made in Microsoft Paint

if you’d like to jump somewhere specific, click below please:

NEXT PAGE: Bracket breakdowns

This one stat will, in fact, not change your life

Chances are, during Championship Week, you’ll be hearing the following statistic left and right:

“Every champion other than 2014 Connecticut in the KenPom era has ranked in the top 20 of offensive and defensive efficiency.”

On its face, this is a correct stat. If you were to click on kenpom.com right now, you would see that 17 of the last 18 champions, minus 2014 UConn, did indeed rank in the top 20 of both categories. I’ll even ignore Dan Dakich saying during the Green Bay/Northern Kentucky game that every champion has ranked in the top 20 of both; he is 94.4% accurate, at least, under this definition.

However: we have a clear issue that seemingly no one at ESPN, CBS, or the variety of networks that broadcast college basketball seem to be discussing. The KenPom rankings referenced are end-of-season rankings, not pre-tournament rankings. So, yeah, no wonder every champion ended up in the top 20! Here’s the actual pre-tournament rankings for every champion in the KenPom era.

  • 2002: Maryland – 5th AdjO, 11th AdjD, 3rd overall
  • 2003: Syracuse – 16th AdjO, 33rd AdjD, 20th overall
  • 2004: Connecticut – 14th AdjO, 7th AdjD, 5th overall
  • 2005: North Carolina – 4th AdjO, 6th AdjD, 2nd overall
  • 2006: Florida – 14th AdjO, 18th AdjD, 6th overall
  • 2007: Florida – 1st AdjO, 14th AdjD, 2nd overall
  • 2008: Kansas – 1st AdjO, 3rd AdjD, 1st overall
  • 2009: North Carolina – 1st AdjO, 39th AdjD, 3rd overall
  • 2010: Duke – 4th AdjO, 5th AdjD, 2nd overall
  • 2011: Connecticut – 22nd AdjO, 25th AdjD, 16th overall
  • 2012: Kentucky – 2nd AdjO, 6th AdjD, 1st overall
  • 2013: Louisville – 17th AdjO, 1st AdjD, 2nd overall
  • 2014: Connecticut – 58th AdjO, 12th AdjD, 25th overall
  • 2015: Duke – 3rd AdjO, 37th AdjD, 6th overall
  • 2016: Villanova – 15th AdjO, 7th AdjD, 5th overall
  • 2017: North Carolina – 4th AdjO, 25th AdjD, 3rd overall
  • 2018: Villanova – 1st AdjO, 23rd AdjD, 2nd overall
  • 2019: Virginia – 2nd AdjO, 5th AdjD, 1st overall

So, in fact, only 11 of the 18 champions in the KenPom era – barely over half – offered both a top 20 offense and top 20 defense. Generally, the side of the ball that’s been lacking is defense; other than 2003 Syracuse and the two Connecticuts, the other four teams with sub-20 defenses all entered with offenses ranked 4th or higher. Even 2014 Connecticut and 2003 Syracuse did at least have one side of the ball in the top 20, with UConn having one of the strongest defenses in the field.

This particular talking point has irked me for some time. In an era where four of the last six champions didn’t have top 20 units on both sides of the ball, it seems extremely silly to keep promoting this to viewers and giving them the wrong idea. Is it better for a team to be well-rounded on both sides of the ball? Obviously, yes. But it’s not the thing that decides a champion.

Here are several other statistics, all of which are actually true and are more accurate than the one ESPN is using, that I would suggest broadcasters and college basketball tastemakers use.

  • In the KenPom era, 15 of 18 champions ranked in the top six nationally prior to the Tournament beginning.
  • Seven of the last eight champions have had at least one side of the ball rank in the top seven nationally.
  • 17 of the 18 champions in the KenPom era, other than 2014 Connecticut, had both a top 40 offensive and defensive efficiency.
  • The #1 overall KenPom team has won the Tournament only three times in 18 years.

Are we good? We’re good. Let’s keep this from happening all March long.

Close games, luck vs. skill, and why Auburn and Washington are closer than you’d think

In between missing several corner threes at the gym Thursday morning, I posted this on Twitter:

While sitting on the toilet at my day job about three hours later, I posted this:

These results are similar, yet different. It leads me to three separate conclusions:

  1. I would consider this one of the more successful and useful uses of my personally-limited iPhone Screen Time.
  2. That said, the word “decree” is pretty melodramatic. Who thought of this word? Why do we need it?
  3. We treat winning and losing close games a bit differently. If we win, there appears to be slightly more luck involved; if we lose, we did not have enough skill to get us over the top. Also, there was luck involved.

The two test cases for this were Auburn and Washington. By a pure W-L standard, the two teams are having fairly similar seasons in games decided by 7+ points. Auburn is 12-3; Washington is 11-5. In these games, Auburn is averaging a +12.7 point differential; Washington, +8.3. Generally, we would draw from this that Auburn is a better team than Washington, though it’s only about a four-point gap. That’s almost exactly what KenPom says, as they have Auburn as about 4.5 points better on a neutral court before you factor in tempo.

Given that we also know that Auburn and Washington have each played 10 games decided by 6 points or fewer, we would guess that their final W-L records are fairly close. Since Auburn’s point differential in 7+ point games is higher, they would most likely go 6-4 in their close games. Washington, meanwhile, would go about 5-5 with a nearly equal chance at 4-6. If these were true, you would expect Auburn’s overall record to be 18-7, with Washington at either 17-9 or 16-10. Auburn’s better, of course, but the gap is very small.

Of course, that’s not why you’re here. Auburn is 10-0 in games decided by six points or fewer; Washington is 1-9. Overall, this lends the two teams very disparate records: Auburn is 22-3, Washington 12-14. Clearly, Auburn has the Clutch Factor, the all-important Experience (4 seniors in their main lineup, along with a senior sixth man), the Vince Young “he just wins games” argument on their side. If you ask any SEC-based talking head, Auburn Plays the Right Way. They Make the Plays That Matter. They are LeBron, except for all the times LeBron has missed a game-winning shot.

Washington, meanwhile, clearly does things wrong. How else do you explain a 1-9 record in close games? Clearly, their rotation full of freshmen and sophomores just isn’t ready to win. They have no clutch players. Their skill level, despite having three possible first round NBA Draft picks, is just not high enough to win. Luck? What’s luck when you can’t trust anyone on your roster to make shots that matter?

If we’re taking those poll results honestly, we’ve thankfully moved past the stage where the majority of viewers are fully Team Luck or Team Skill. There is an inherent skill in winning close games in certain sports – ask Dabo Swinney or Urban Meyer about their gaudy records in one-score games in college football. Heck, the names you would expect to lead a “records in close games list” lead said list: Bill Self, Mark Few, Jim Boeheim, Dana Altman, Steve Fisher, etc. These are objectively great coaches.

But how do we settle the fact that coaches we also greatly respect, like Billy Donovan, Bob Huggins, Frank Martin, Gregg Marshall, and others, are either right at or below .500 in close games for their career? Were they simply outcoached and outclassed in those losses? Maybe. But that can’t be the excuse every time; otherwise, we would begin to convince ourselves that Andrew Toole – 72-48 in close games at Robert Morris, the highest WP% in basketball – is the most underrated coaching prospect in America. Clearly, Mr. Toole – who I don’t doubt is pretty good at what he does – learned something from going 12-15 in close games from 2015-17 to go 5-2 this year.

The answer to the initial question I proposed, I think, is probably “a bit of both.” Just like in most sports, the better team in a game is probably slightly more likely to win a one- or two-possession game. However, that isn’t always the case. The better team doesn’t win every game, regardless of final margin. Sometimes, weird stuff happens. That’s where luck comes in. It can come in for both the losing and winning team, just like luck could propel a lesser team to defeat a better one.

Anyway, this isn’t meant to be an end-all, be-all answer. I obviously believe Auburn’s a better team than Washington. I obviously think they’ve got greater upside. However: I think we look at close games, particularly in terms of wins and losses, in a very odd manner. I don’t think Auburn possesses some sort of magical clutch gene, just like I don’t think Washington possesses an evil voodoo doll gene. To be honest, I value games like Auburn’s blowout loss to KenPom #103 Missouri on Saturday the exact same as I do their one-point double-overtime win against Ole Miss. If we all agree to stop giving outsized importance to one or two-possession games and agree to value a team as a whole, I think we’ll be well on our way to a much better, smarter coverage of basketball.